Pulse Tech - E-commerce Analytics Dashboard
Hello, Dribbblers!!! 🏀
✨ Overview
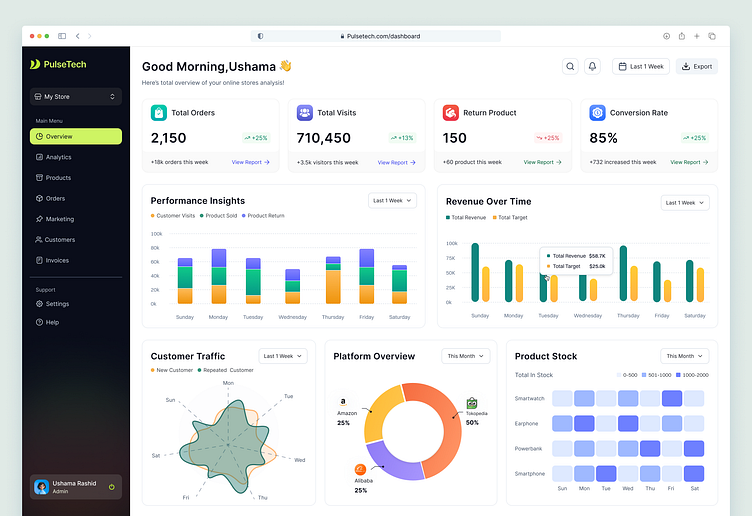
Today I've crafted an E-Commerce Dashboard for Pulsetech an online platform. This Dashboard is a dynamic, data-driven solution crafted to empower e-commerce businesses with real-time insights. Designed with a clean, intuitive interface, it provides a comprehensive overview of key metrics, enabling users to make informed decisions that drive growth and optimize performance.
🚀Features:
Interactive Data Visualization: Our designed dashboard showcases Performance Insight, Revenue Over Time, Total Orders, and Conversion Rate through sleek, interactive charts and graphs.
Real-Time Analytics: Stay ahead of the competition with up-to-the-minute data that tracks conversions, revenue, and user behavior across multiple channels.
User-Centric Design: A responsive layout with easy-to-navigate elements ensures that complex data is accessible and actionable, tailored to meet the needs of both novice and expert users.
Performance Tracking: Monitor KPIs such as Average Order Value, Customer Lifetime Value, and Conversion Rates, all in one cohesive view.
Customizable Reports: Empower users to create tailored reports highlighting the metrics that matter most, supporting data-driven decision-making.
So, do you think this is cool?
Press "L" or ❤️ if you like it and don't hesitate to share your feedback in the comments section. Thank you! Have a nice day 😎

