Carbon Analytics Data Driven Dashboard - Charts/ Graph / Company
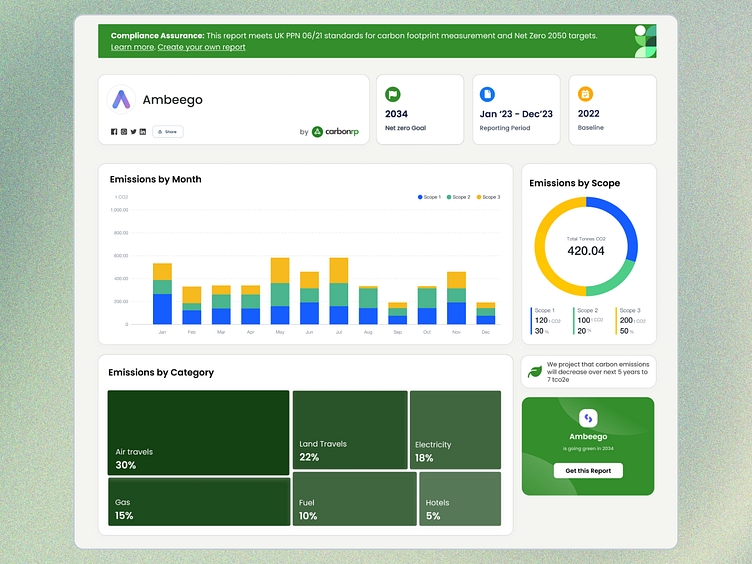
The dashboard combined multiple sources of data into usable graphs, and intuitive dashboard making the overall report very usable, and elegant so the reports can be shared.
Want one for you?
Book a Free call with me to consult on your design issues: https://cal.com/salman-mustafa
