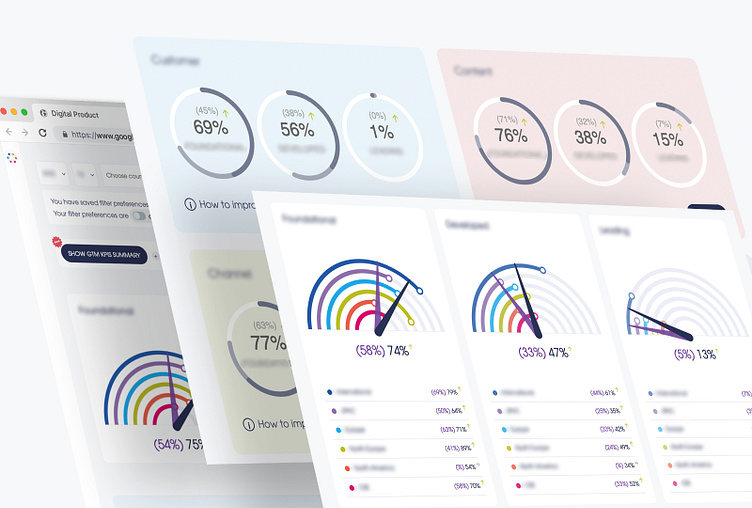
Multilayered big data business intelligence dashboards system
Hi everyone! 👋
I was approached by a global pharmaceutical company to address the challenge of managing large, unstructured datasets that were previously scattered across various Excel files. My task was to design a solution that would present this data in a clear, highly interactive format, with built-in multilayered granularity to accommodate different user needs. As the project progressed, I was responsible for consolidating data from multiple channels and datasets into a single, cohesive online dashboard. This dashboard featured visually compelling representations of key performance indicators (KPIs) and included integrated feedback surveys, allowing internal teams to provide real-time insights.
My role was to reaserch, plan and create visual representation of data in charted, graphical way so that end users can find the data for further analysis and business intelligence. As the project was in continues development for over 3 years, with 2 weeks sprint cycles I was tasked to provide biggest possible value to stakeholders on every iteration by focusing on key performance metrics, automated reports structure and innovative ways of presenting that data to internal teams that would improve their work.
As a result we’ve managed to shorten reports creation time by 96% by allowing easy access to printable and reusable design elements that could be used in automated and hand made reports for multiple international teams. The project spanned over 1 milion datapoints and included teams from over 60 countries worldwide that used and are continuously using the solution that me and my team designed and developed.
