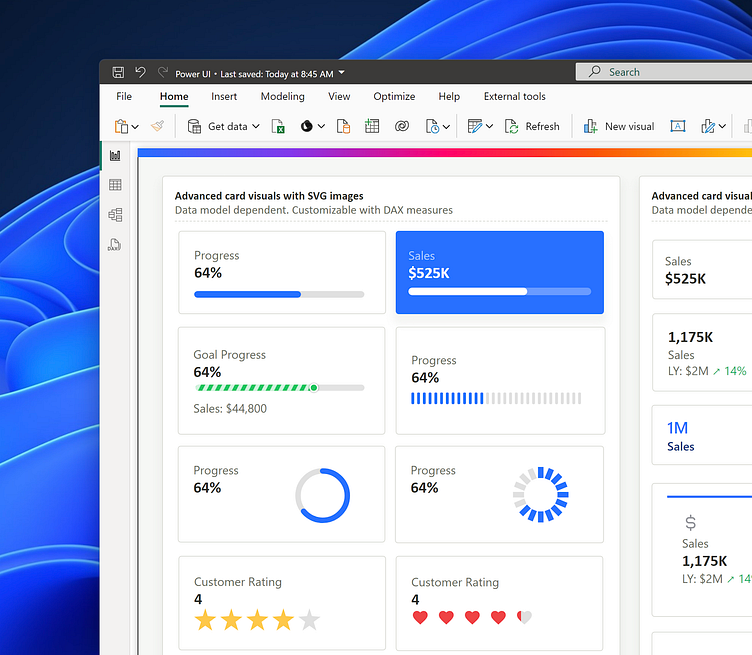
Progress Bars in Power BI
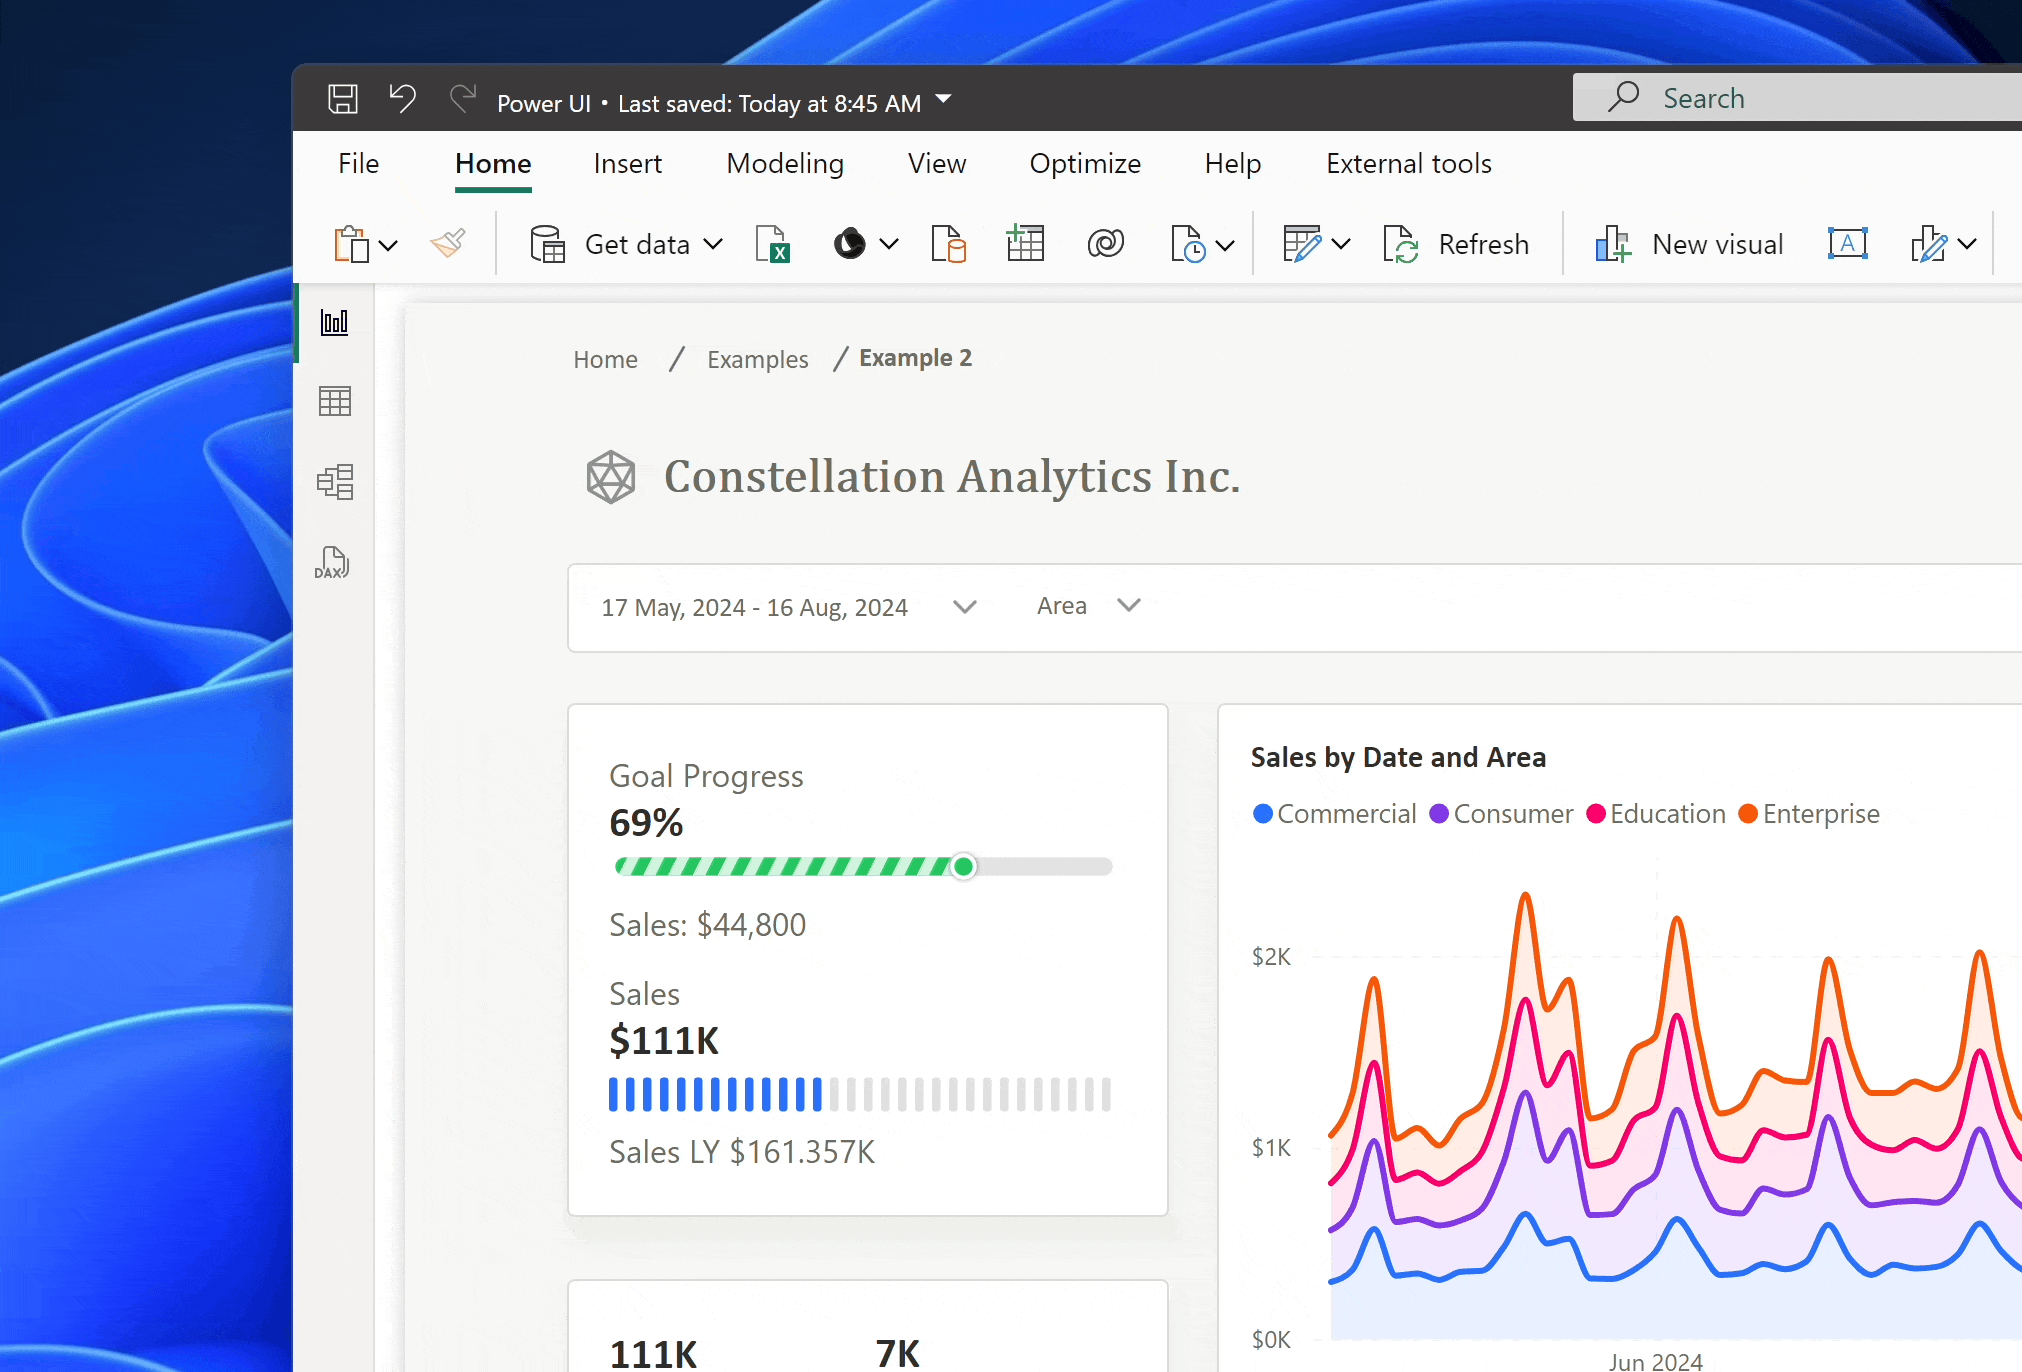
Power BI doesn't have a native progress bar visual but most modern web dashboards have some form of progress bar. I've been playing around with using dynamic SVG code written with DAX to make my own and I really like how it's turned out. SVGs can even be animated which may be distracting in practice but just the fact you can do it in Power BI was really neat to me and I thought I'd share. They're dynamic in so far as you can set the "progress value" to a dax measure or change the colors by adding logic to assign hex codes. I added some code below that shows how the progress bar rectangles were made.
Custom GPT to help create these DAX | SVG measures: I've been using ChatGPT to help generate the code and it's been super effective. The challenge seems to be feeding the DAX variables into the right spots in the SVG to get them working and they have to be wrapped in double quotes which could be tedious writing the code by hand but it's no problem for the GPT. I built a GPT to help create these measures that create the SVG code. If you want to make your own SVG visuals you can use the GPT here: https://chatgpt.com/g/g-v4KFMr0Da-power-ui-gpt
You can use these measures by going to the Image setting on the advanced card visual and setting the Image type to "Image URL" and then setting the value to the measure just created.
✨ Designed with Power UI
Elevate your data visualization and analytics with expertly crafted interfaces tailored to meet your needs.
