003 · Color Palettes for Data Visualization
Data visualization gets a colorful upgrade! 🎨
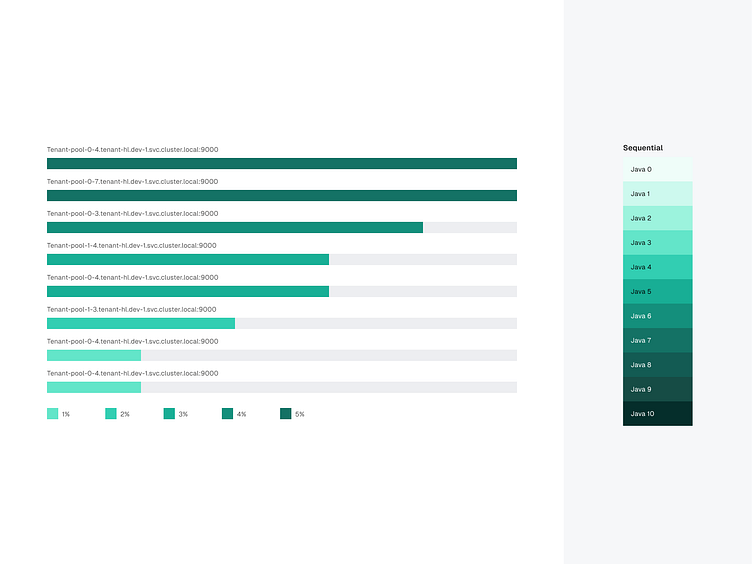
Check out how we expanded MinIO's color palette to create a vibrant and accessible spectrum for these data visualizations.
Making performance comparisons accessible for all. This bar charts utilizes our expanded MinIO color palette, ensuring clear communication of data insights with an emphasis on inclusivity.
More by Shortcut View profile
Like


