Day #018 - Analytics Chart | 100 Days UI Challenge
THE CHALLENGE
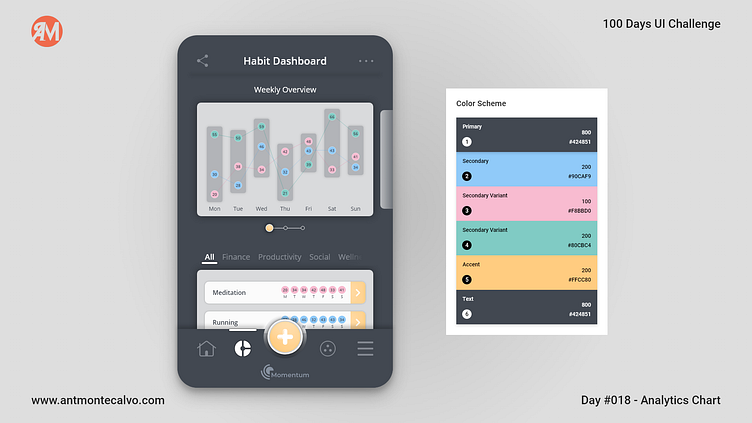
For today’s challenge, I designed an analytics chart for a habit tracking dashboard. The focus was on creating a clear and visually engaging interface that allows users to easily track their progress over the week. The chart displays daily activity metrics in a way that is both informative and aesthetically pleasing. The color scheme was carefully selected to enhance readability while maintaining a cohesive look throughout the dashboard. This design aims to provide users with insights that help them stay on track with their habits and goals.
CONTACT AND SUPPORT
Feel free to reach out for work opportunities at antmontecalvo@gmail.com.
I appreciate your comments, likes and shares.
