Environmental Impact Dashboard
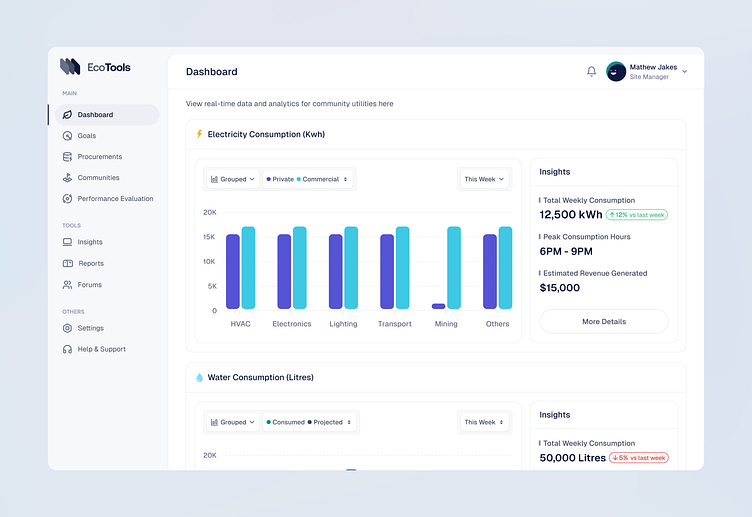
I’m excited to share my latest project: a responsive dashboard designed to help small towns manage their utilities and environmental impact with ease. This dashboard aims to make complex data clear and actionable, whether you’re on a desktop or mobile device.
Key Features:
• Seamless Responsiveness: The dashboard adapts perfectly across devices, ensuring a consistent and accessible experience whether you’re on a desktop or mobile.
• Clear Data Visualization: Custom widgets turn raw data into easy-to-understand visuals for electricity, water, gas, carbon footprint, and waste production, making it simple to monitor everything at a glance.
• Minimalist UI: A clean, focused design that presents even complex data in a straightforward, user-friendly way.

