Temperature Dashboard: Real-Time Monitoring for Your Crops
🌡️ Introducing Our Temperature Dashboard – The Ultimate Tool for Crop Monitoring! 🌡️
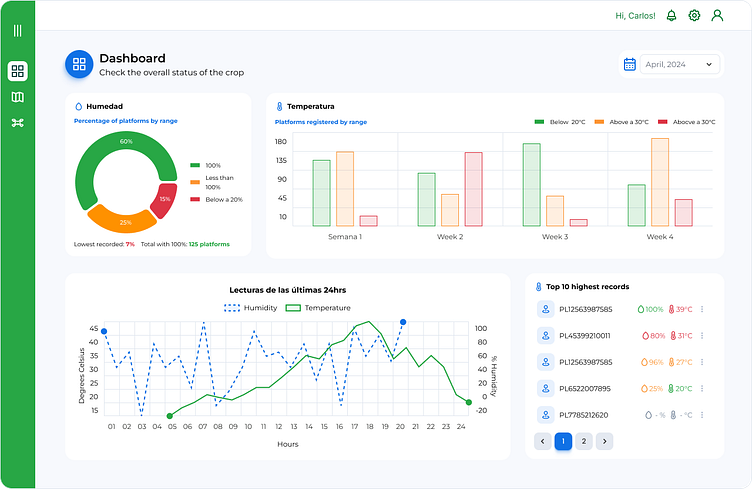
Our dashboard provides an insightful overview of temperature measurements across various monitoring platforms in your field. Featuring real-time graphs and historical data, it helps you keep track of your crop’s environmental conditions with ease.
📈 Key Features:
Real-Time Graphs: View up-to-date temperature readings with interactive graphs.
Top Records: Identify the highest temperature readings to monitor extreme conditions.
Platform Comparison: Compare temperature data from different measurement platforms.
Monthly Summary: Access comprehensive monthly reports to analyze trends and patterns.
Stay ahead of potential issues and ensure optimal growing conditions with our detailed temperature insights.
-----------------------------------
👍 Like and share if you find this useful!
📧 Contact me at vimillanvi@gmail.com for more information or collaboration opportunities.
