Fintech Dashboard Design (Dark Mode)
🚀 Excited to share a sneak peek of my latest fintech dashboard design! This comprehensive dashboard is designed to provide a clear and concise overview of key project metrics and testing coverage.
📊 Key Sections:
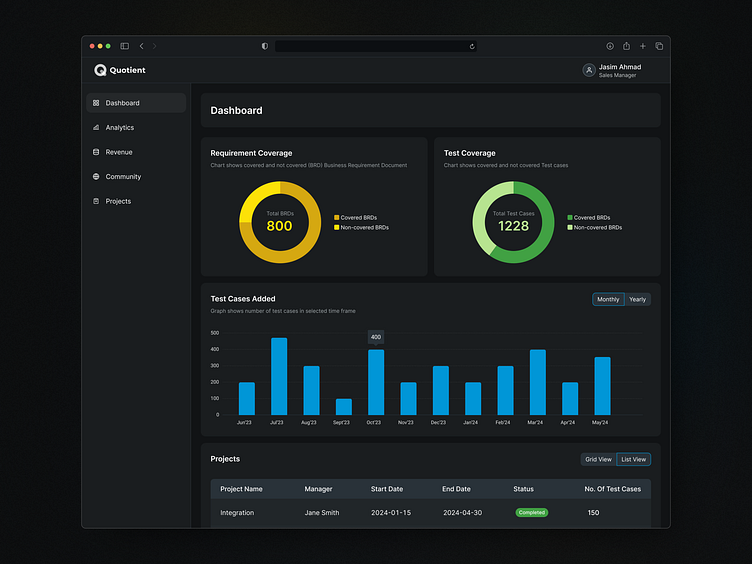
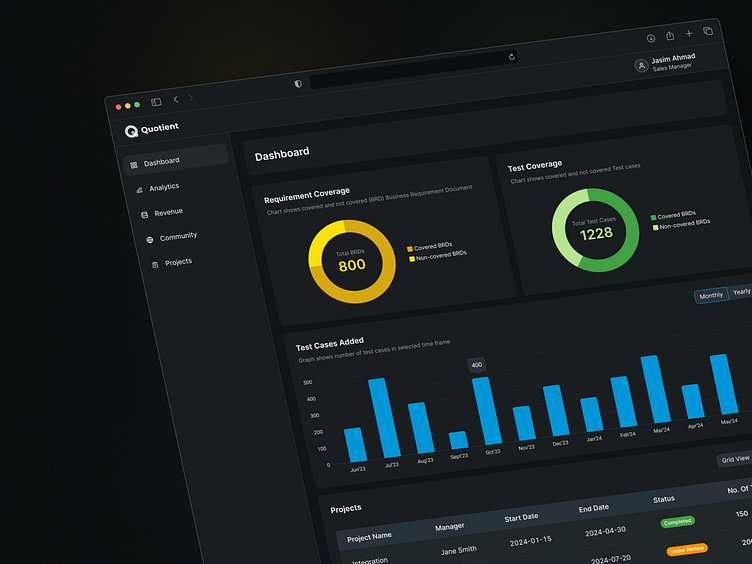
Requirement Coverage: Visualizes the Business Requirement Document (BRD) coverage with a chart displaying covered and not covered requirements.
Test Coverage: Shows the status of test cases with a chart indicating covered and not covered test cases.
Test Cases Added: A dynamic graph illustrating the number of test cases added within a selected time frame.
Projects Section: A detailed table displaying project information, including project name, manager, start and end dates, status, and the number of test cases.
💼 This dashboard ensures project managers and stakeholders have quick access to vital project and testing information, aiding in efficient project tracking and decision-making.
🔗 Stay tuned for more updates and feel free to leave your feedback!
