Shipment Management Dashboard | ShipFast
Overview:
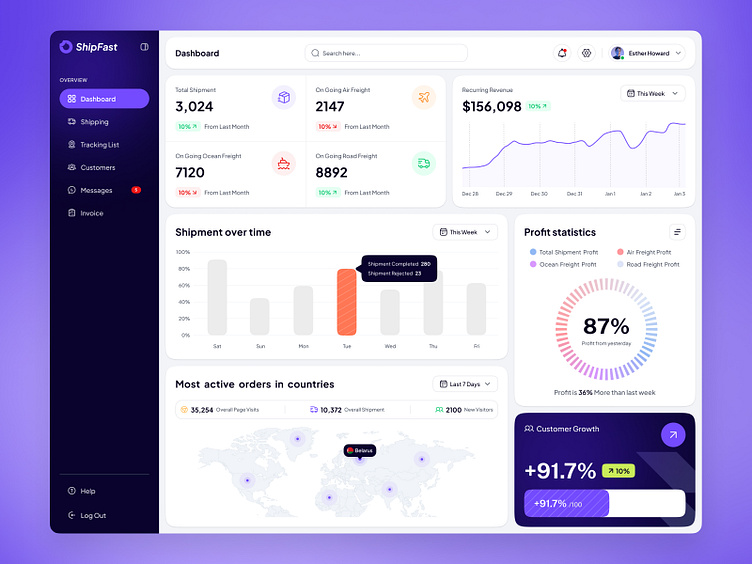
Presenting the ShipFast Dashboard UI, an intuitive and sleek interface designed for efficient shipment management and data visualization.
The design emphasizes clarity and usability, ensuring that users can effortlessly monitor and analyze shipment data. This dashboard is perfect for logistics managers and team leaders seeking to streamline their operations and make data-driven decisions.
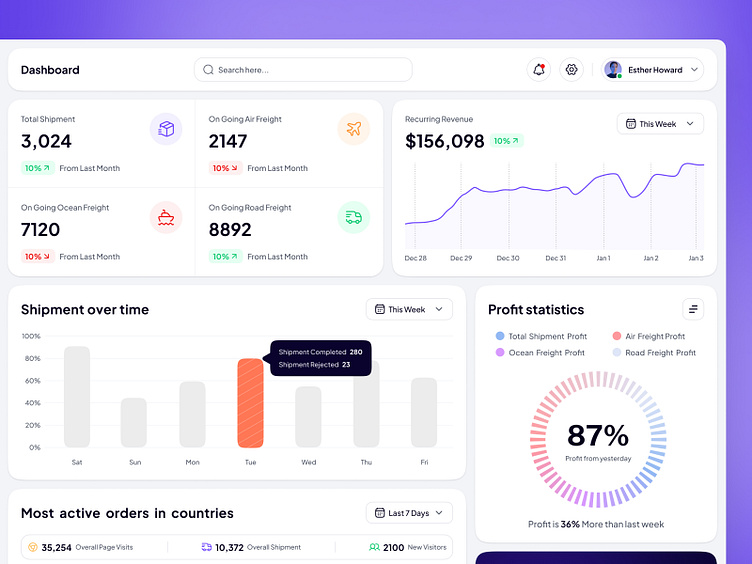
⚓ Shipment Over Time:
An interactive bar chart displays shipment completion and reception rates over a weekly timeline, providing a clear view of weekly performance.
⚓ Profit Statistics:
A detailed pie chart showcases the distribution of profits across different freight types—air, ocean, and road
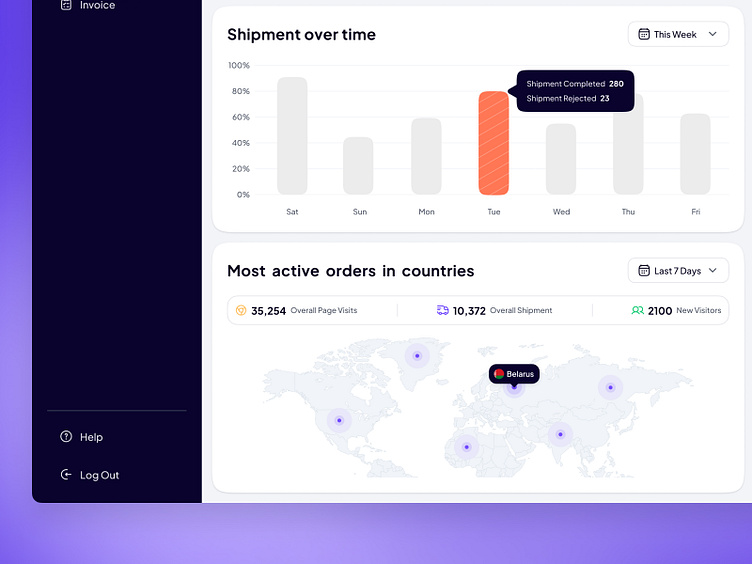
⚓ Most Active Orders by Country:
A world map highlights the most active shipment regions, offering specific country statistics for targeted insights.
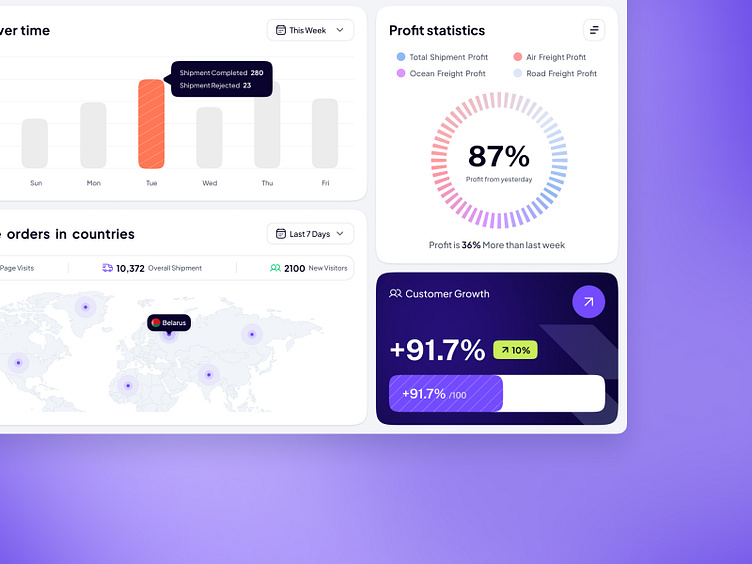
⚓ Customer Growth:
Dynamic growth metrics are shown with a percentage increase and a visual progress bar, indicating a substantial growth rate.
⚓ Visualization:
The design ensures clarity and usability, making it easy for users to monitor and analyze shipment data effectively.