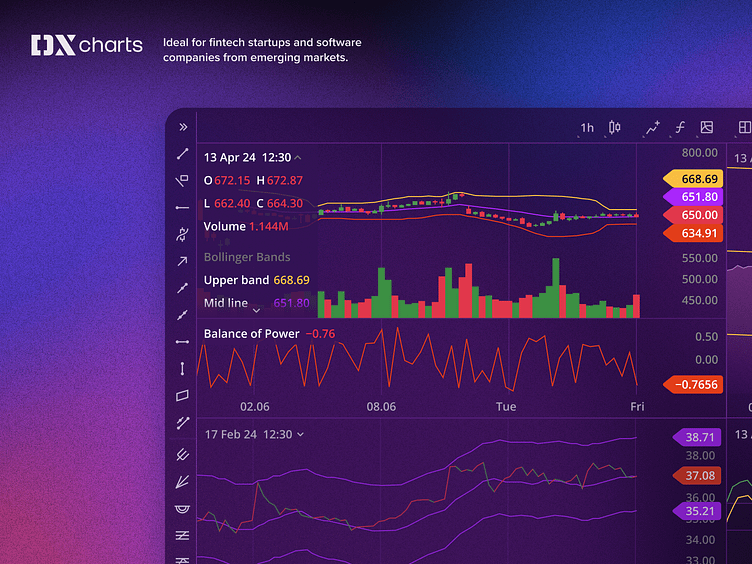
DXcharts - Financial charting library
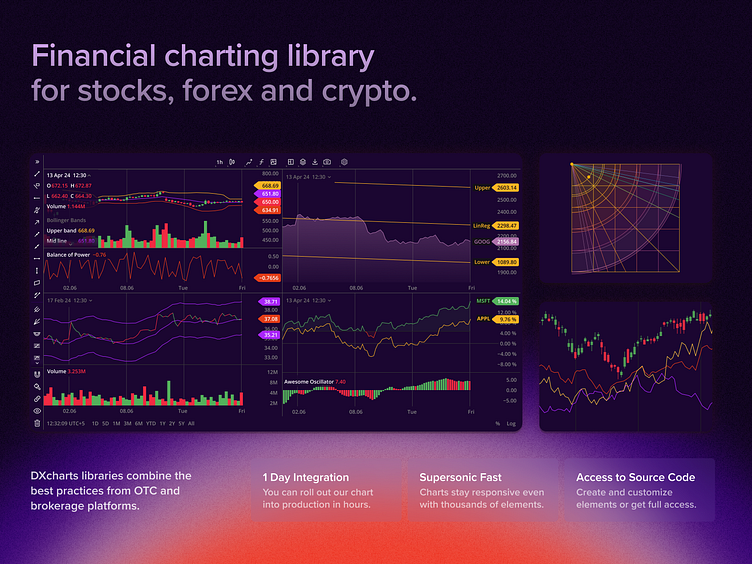
DXcharts is an advanced charting library for market data visualization, technical analysis, and trading. It features 50 drawing tools and over 100 indicators and enables users to create custom indicators with our DXscript programming language, which can be used without prior coding experience. DXcharts is a stand-alone product that you can embed on your website or add to your platform as a widget in as little as a day.
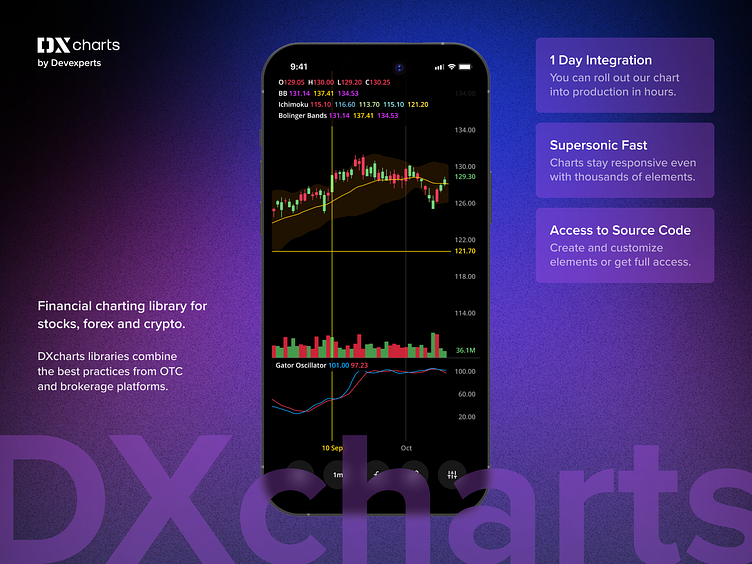
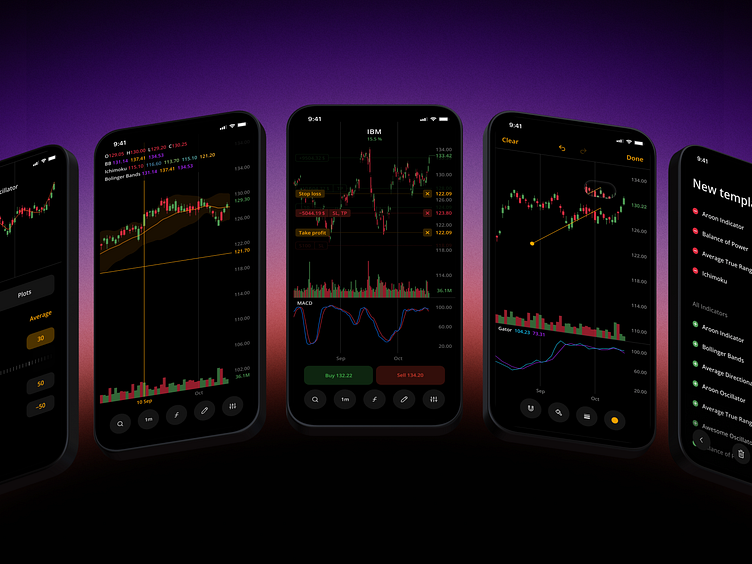
DXcharts for mobile apps
DXcharts for mobile delivers freedom of action with full functionality. Designed with developers in mind. Developers can fully customize the charting library to blend seamlessly with an app's existing branding.
Inspired by this design? Request your custom design here: https://devexperts.com/ui-design/?utm_source=dribble&utm_medium=profile&utm_campaign=ux-ui-design
