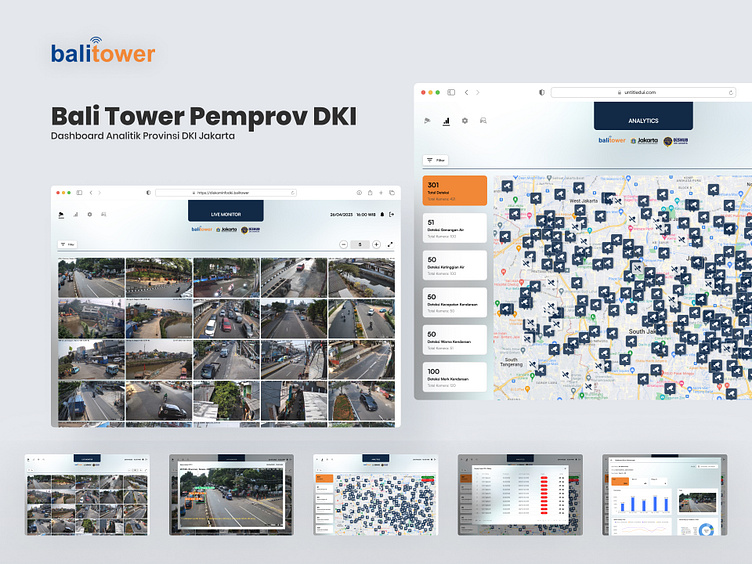
CCTV Analytics Web
Bali Tower Pemprov DKI - Comprehensive CCTV Analytics Dashboard
Description: This project is a comprehensive analytics dashboard developed for Bali Tower in collaboration with the Provincial Government of DKI Jakarta. The system integrates and monitors over 680 CCTV cameras across the city, enabling a centralized and efficient surveillance network. The design aims to facilitate real-time tracking, incident detection, and provide valuable data analytics to enhance city security and traffic monitoring.
Key Features:
Live Monitoring Grid: A clear, scalable grid layout showing live footage from multiple CCTV cameras. Users can monitor various city areas in real-time for enhanced situational awareness.
Interactive Map: A large, detailed map view pinpoints the locations of all connected cameras across Jakarta, allowing users to zoom in for specific areas of interest.
Incident Detection & Analytics: The side panel provides instant data insights such as air pollution, water levels, and traffic speeds. Critical incident detections are highlighted for quick access and further analysis.
Filter Options: Advanced filtering functionality to sort and view specific types of data (e.g., air quality, traffic, water levels) for faster decision-making.
Analytics Dashboard: Detailed analytics charts that summarize key data points, including the number of incidents and trends over time, helping the government make data-driven decisions.
Design Process:
Research & Requirement Gathering The design began with extensive research into the existing surveillance infrastructure and needs of city authorities. I worked closely with stakeholders to understand pain points and critical data visualization needs.
Wireframing & Prototyping Low-fidelity wireframes were created to outline the layout of the dashboard, with a focus on providing users with maximum clarity while handling a large volume of live video feeds and data points.
High-Fidelity Design & UI/UX Optimization I moved into high-fidelity designs, ensuring the visual hierarchy was balanced between live video monitoring and data analytics. A clean, modern design language was employed to enhance user experience, with clear icons, color-coded information, and smooth navigation.
Testing & Iteration User feedback was gathered from early prototypes, leading to multiple iterations to refine the user experience. Features like filtering, map interaction, and live monitoring were further optimized based on feedback.
