Analytics Chart - Daily UI #018

I’m excited to share my latest design for the Daily UI challenge - Day 18: Analytics Chart! 📊✨
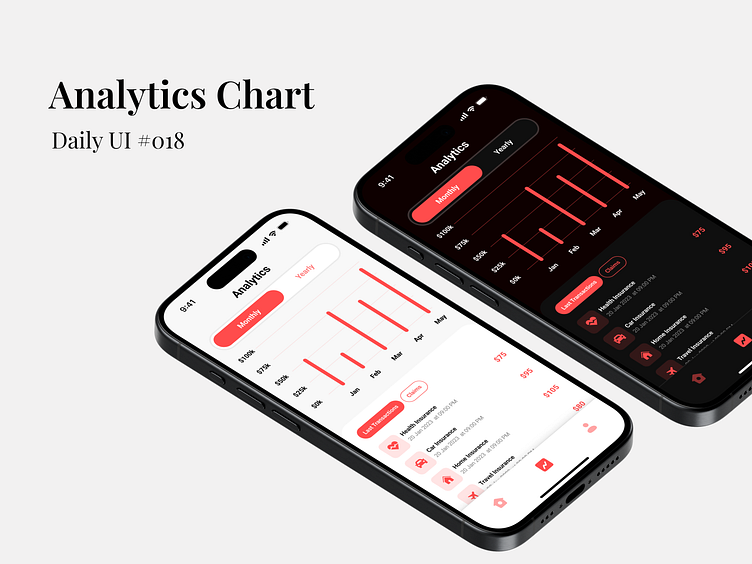
This design features a clean and modern interface with both light and dark modes to suit different user preferences. The chart provides a clear visual representation of monthly and yearly data, making it easy to analyze and interpret information at a glance.
💡 Design Highlights:
Light & Dark Mode: Ensuring accessibility and user preference.
Interactive Tabs: Switch between Monthly and Yearly data views.
Recent Transactions & Claims: Easily track your latest activities.
Your feedback and suggestions are always welcome! 😊
------------------------------------------------------------------------------------------------------------
Let's talk and Collaborate:
