Analytics Chart ( DailyUI 018 )
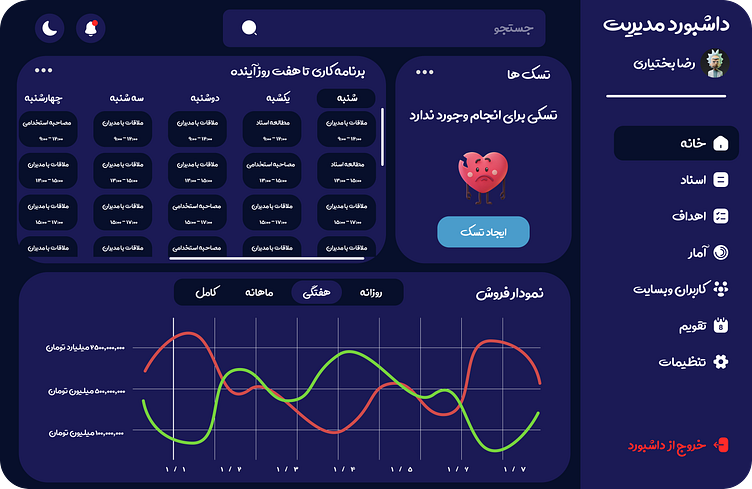
Hey folks! 👋 Check out my latest DailyUI challenge - the Analytics Chart (#018). This sleek and user-friendly chart is designed to help you track and analyze data effortlessly. 📊
Features:
- Clean design: Easy on the eyes with a minimalistic approach.
- Interactive elements: Hover effects for detailed insights.
- Color-coded data: Quickly distinguish between different metrics.
- Responsive layout: Looks great on any device.
Perfect for data nerds and business folks who want to stay on top of their game. Let me know what you think! 🚀
contact me:
LinkedIn : https://www.linkedin.com/in/reza-bakhtiari/
Instagram : rezabakhtiari.uiux
