Daily UI #018 – Analytics Chart
Daily UI #018 – Analytics Chart
Bonjour ! ☀️
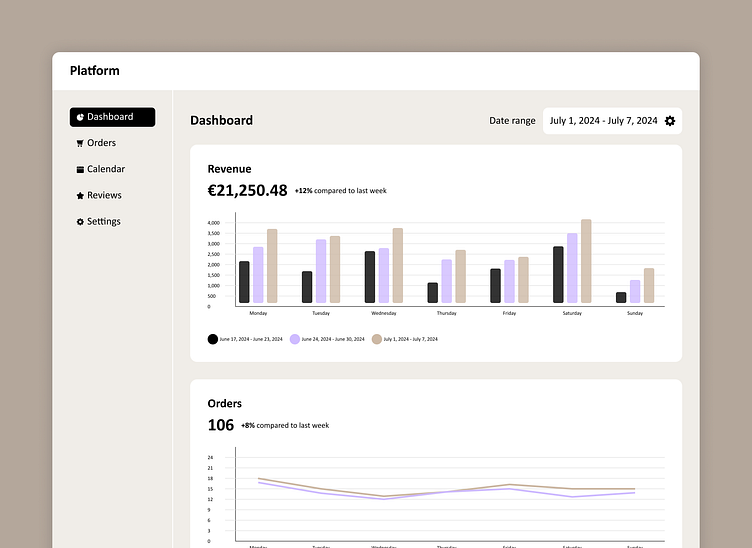
For my 18th #DailyUI, I am submitting my vision of an analytics chart! I have designed this chart based on a dashboard from an e-commerce platform, focusing on order management and revenue tracking. The chart visualizes key metrics such as total orders, revenue growth, and average order value over a period.
Feel free to leave your feedback!
More by Karl Kimbembe View profile
Like
