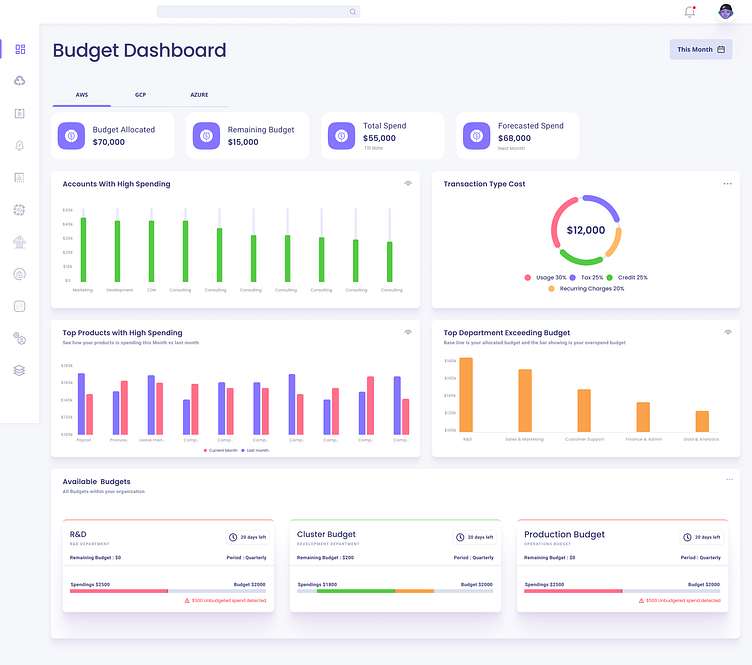
Budget Dashboard of Cloud Cost Optimization Product
Budget Dashboard
is a key component, specifically tailored for financial analysts, cloud administrators, and department managers. This reporting module offers a centralized platform to monitor and manage budget allocations, spending trends, and forecasted expenditures across various cloud platforms.
Key Features of the Budget Dashboard:
Cross-Platform Support:
Users can access budget-related information for AWS, GCP, and Azure through dedicated tabs.
Flexible Periods:
The dashboard allows users to select from various periods (1 day, 1 week, 1 month, quarter, half-year, and annual) to view budget and spending data.
Comprehensive Data Cards:
The dashboard displays key budget metrics through data cards, including:
Budget Allocated: Total budget for the selected period.
Remaining Budget: Budget left after expenditures.
Total Spend: Total expenditure for the selected period.
Forecasted Spend: Projected spending for the remaining budget cycle.
Insightful Widgets:
The dashboard includes widgets for detailed insights:
Accounts with High Spending: Displays accounts with the highest spending.
Transaction Type Cost: Breakdown of spending by transaction types.
Top Products of High Spending: Shows products with the highest spending.
Top Departments Exceeding Budget: Displays departments exceeding their budget allocations.
Detailed Budget Categories:
Additional data cards provide insights into specific budget categories:
R&D Department Budget
Cluster Budget
Production Budget
Interactive Elements:
Users can click on data cards and widgets to access detailed views and comprehensive reports, facilitating in-depth analysis and informed decision-making.
Error Handling and Support:
The dashboard includes filtering options, historical data review, and support assistance to resolve any discrepancies in budget data or spending trends.


