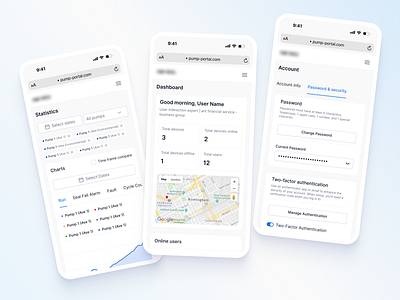
Pump station management system | Pump activity graph
This graph provides users with clear information about the operating status of pumping systems, including periods of activity and rest, differences in load and other key parameters. It allows you to quickly monitor the operation of the pumps and respond in time to any changes or problems.
Let us know what you think. Thanks for watching and stay tuned for more 🚀
Have a project in mind? Contact us 📧
Follow us 📲