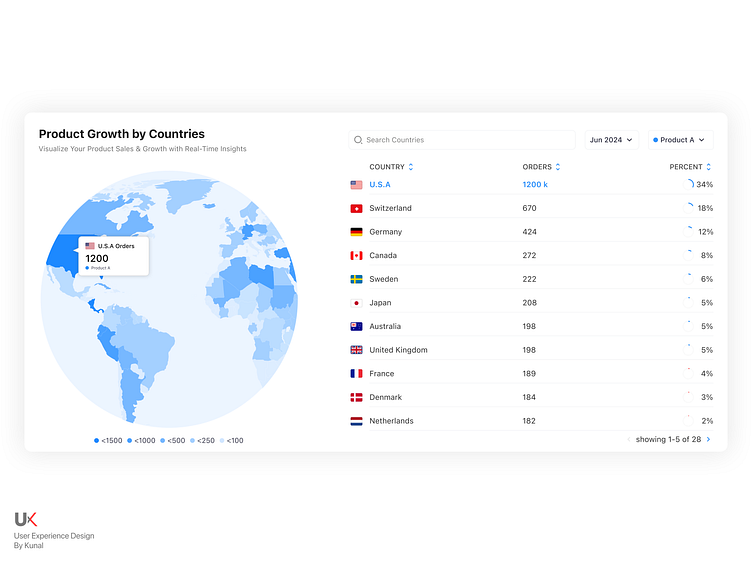
Heat Map World Chart UI Design
World Heat Map Chart Design - Orders by Country
Explore my new data visualization masterpiece - the World Heat Map Chart showcasing global order distribution by country. This detailed and interactive heat map provides a comprehensive overview of orders, highlighting key markets and revealing patterns in international sales performance.
Key Features:
Global Coverage: Visualize order data from countries around the world, offering a holistic view of your market reach and penetration.
Interactive Elements: Hover over each country to display detailed order statistics, including total orders, percentage share, and growth trends.
Color-Coded Insights: Easily identify high-performing regions with a gradient color scale, from cool shades indicating lower order volumes to warm, vibrant colors representing higher concentrations of orders.
Responsive Design: Optimized for various devices and screen sizes, ensuring a seamless experience whether viewed on desktop, tablet, or mobile.
Data Integration: Compatible with your existing data sources, allowing for real-time updates and accurate representation of your order distribution.
Design Process: Crafted with precision and user experience in mind, this heat map design involved meticulous data analysis and user research. The aim was to create an intuitive, visually appealing, and informative tool that empowers businesses to make data-driven decisions and strategize effectively.
Feedback and Collaboration: We value your feedback! Share your thoughts and suggestions to help us refine and enhance this tool. Let’s collaborate to create even more powerful and insightful visualizations.
Dive into the details and uncover the stories behind the numbers with our World Heat Map Chart. Perfect for analysts, marketers, and business leaders looking to gain a deeper understanding of their global order trends.
