Stock Price Chart for SPY ETF
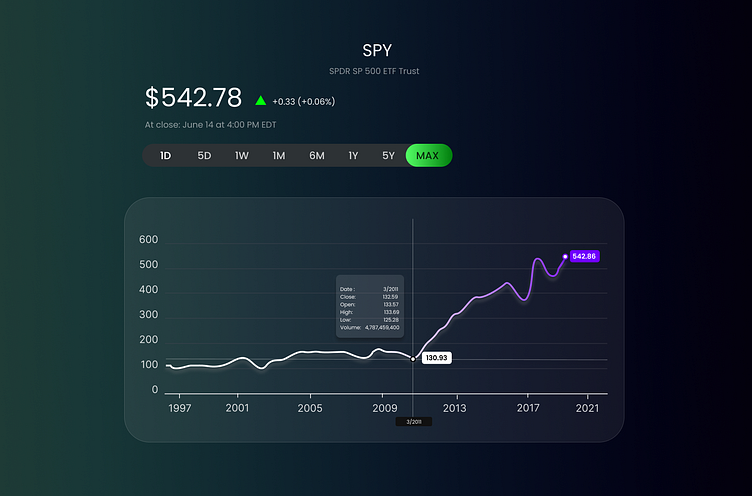
This sleek and modern stock price chart showcases the performance of the SPDR S&P 500 ETF Trust (SPY) over a maximum time period. The chart highlights key data points including the opening, high, low, and closing prices, along with volume, providing a comprehensive view of the stock's performance history. The interface is designed for a seamless and engaging user experience, ideal for financial analysts and investors.
