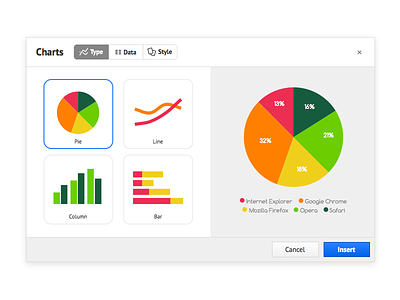
Charts in Prezi
If you wanted to create charts in Prezi – now you can. Select the type, enter some data and format it. You can select the chart object on the canvas in the editor, re-edit parameters and update your render again. The right hand side is the preview window which shows what will be rendered out.
Bonus: the insert menu in the editor now sports 2x icons for your HiDPI monitor viewing pleasure.
More by Prezi Design View profile
Like

