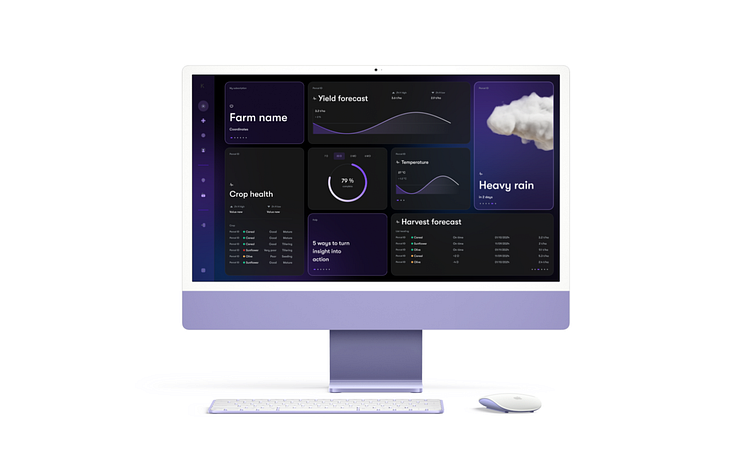
Card based dashboard design
A part of a project I'm working on, this was one of a few iterations of a dashboard I designed for a farming application. As per customer research results, I wanted to highlight weather events that might be significantly harmful to crops, as well as an easy way to keep track of whether crops were reaching their designated growth periods on time.
This was a fun exercise, and a good way to keep up with Figma's variable features!