Analytic AI - Dashboard
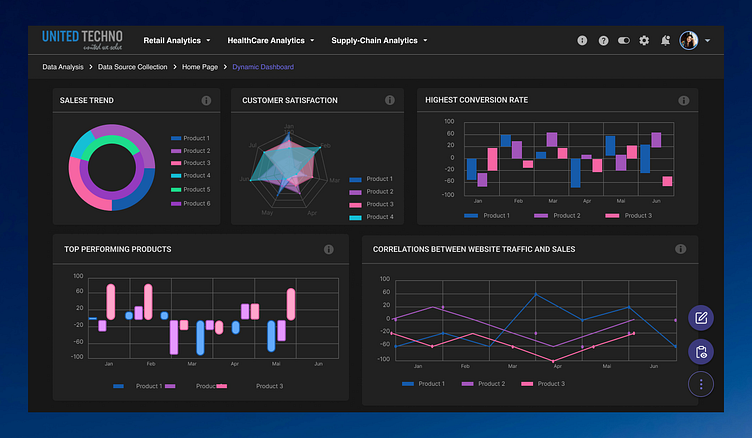
Analytical Dashboard in Dark Theme, blending sophisticated data visualization with an elegant dark aesthetic. This dashboard enables users to upload their data and gain insightful visualizations effortlessly. Here's a comprehensive look at the design process and key components of this project.
User Research:
Conducted surveys and interviews using Google Forms and Zoom to gather insights into user preferences and requirements for analytical dashboards.
Utilized tools like Hotjar and Google Analytics to study user behavior and identify critical areas for improvement.
Wireframing & Prototyping:
Created wireframes in Figma to establish the layout and structure of the dashboard.
Designed interactive prototypes using Adobe XD to test user flows, gather feedback, and refine the design.
Visual Design:
Chose a dark theme to reduce eye strain and enhance the visual appeal of the dashboard, making data stand out vividly.
Selected contrasting colors and typography that complement the dark background while ensuring readability and accessibility.
AI Integration:
Worked with developers to integrate AI functionalities for data processing and visualization.
Enabled the AI to analyze uploaded data and generate real-time insights presented through dynamic visualizations.
User Input and Data Upload:
Implemented a seamless data upload feature, allowing users to drag and drop files or select them from their device effortlessly.
Added user input fields where users can specify parameters and preferences for data analysis.
Dynamic Data Visualization:
Integrated various visualization widgets, such as bar charts, line graphs, pie charts, and tables, optimized for dark mode.
Ensured visualizations are dynamic, updating in real-time based on user inputs and data changes.
