Map Chart
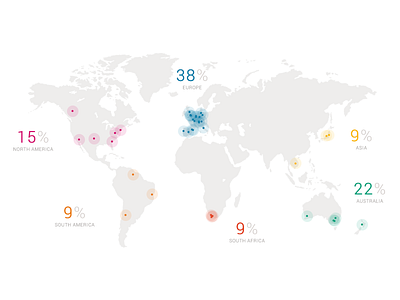
Made this map chart as a visual representation of investments around the globe. Helps user to see the concentration of investments per area to better manage them.
Made this map chart as a visual representation of investments around the globe. Helps user to see the concentration of investments per area to better manage them.