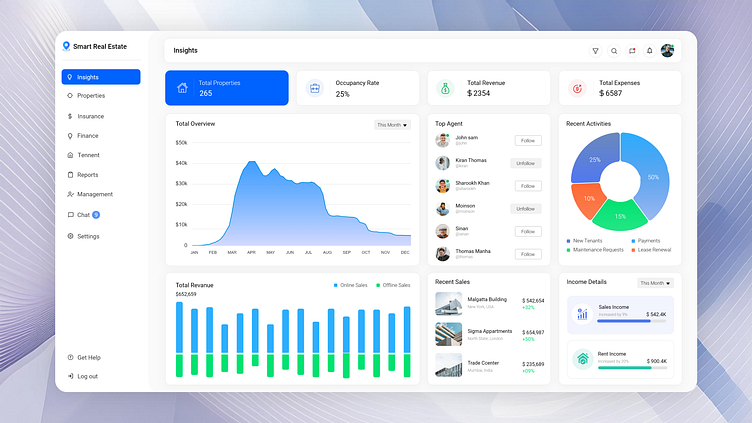
Smart Real Estate Analytics Dashboard
Hi Dribbblers 🏀
I present my new Smart Real Estate Analytics Dashboard UI/UX✨
Smart Real Estate Analytics Dashboard with excellent UI/UX offers a seamless and efficient experience for users by focusing on clarity, accessibility, and functionality. Key characteristics include
Clean and Intuitive Layout: The dashboard is designed with a minimalist approach, ensuring that key data points and metrics are easily accessible. The use of whitespace and a clear visual hierarchy helps in reducing clutter and improving focus.
Interactive Data Visualizations: Incorporates dynamic charts, graphs, and maps that allow users to interact with data through hover-over tooltips, drill-down capabilities, and real-time updates. This interactivity enhances data exploration and comprehension.
Customizable Interface: Users can personalize their dashboard by selecting and arranging widgets according to their preferences. This flexibility ensures that users can prioritize the data most relevant to their specific needs.
Real-Time Data Updates: Ensures that the information displayed is always current, helping users make informed decisions quickly. Real-time updates are crucial for tracking market trends, property performance, and financial metrics.
Responsive Design: The dashboard is optimized for various devices, including desktops, tablets, and smartphones. A responsive design ensures that the dashboard is accessible and functional across different screen sizes and orientations.
Advanced Filtering and Search: Provides robust filtering options and a powerful search function, allowing users to quickly locate specific data, such as properties by location, price range, or status. These tools enhance the efficiency of data retrieval.
User-Friendly Navigation: Features intuitive navigation with clear menu structures, breadcrumb trails, and consistent layout patterns. This makes it easy for users to move through different sections of the dashboard without confusion.
Actionable Insights and Alerts: Highlights key performance indicators (KPIs) and trends, providing users with actionable insights. Customizable alerts and notifications keep users informed about important updates, such as market changes or maintenance issues.
By integrating these features, the Real Estate Analytics Dashboard not only improves the user experience but also empowers real estate professionals to make data-driven decisions efficiently and effectively.
What do you think?
Let me know in the comment section below and don't forget to leave a like to show some support! Thanks! ✨
🖼️ UI Design | 😄 UX Design | 🎉 Illustration | 🛍 Brand Identity | 📝 Graphic Design | 🌐 Web Development | 📱 Mobile App Development | UX Consultation
We are available for new projects
📪 Email: ukrohith01@gmail.com😀
✉️ Have a project idea?
I'll provide a prompt analysis along with a complimentary proposal.
Rest assured, your information is safe and confidential 😀
Thanks for watching , See you next time❤️✌️
Follow me for more!


