Visual GPT: AI-Driven Data Visualization
As a UI/UX designer, I crafted Visual GPT, an intelligent dashboard that enables users to upload data and receive AI-generated visual insights in the form of graphs and tables. Here’s a detailed look at the design process and key components of this innovative project.
Design Process
User Research:
Conducted surveys and interviews using Google Forms and Zoom to understand the needs and preferences of data analysts, business users, and decision-makers.
Analyzed user behavior with tools like Hotjar and Google Analytics to identify key pain points and opportunities for improvement.
Persona Development:
Conducted surveys and interviews using Google Forms and Zoom to understand the needs and preferences of data analysts, business users, and decision-makers.
Analyzed user behavior with tools like Hotjar and Google Analytics to identify key pain points and opportunities for improvement.
Wireframing & Prototyping:
Developed wireframes using Figma to outline the structure and layout of the dashboard.
Built interactive prototypes in Adobe XD to test user flows, gather feedback, and iterate on the design.
AI Integration:
Collaborated with developers to integrate AI capabilities for data analysis and visualization.
Ensured the AI can process uploaded data, analyze it, and generate relevant visual insights in real-time.
Visual Design:
Designed a clean, modern interface with an emphasis on readability and ease of use.
Selected a color palette and typography that enhance data visualization and ensure a cohesive visual experience.
AI Integration:
Collaborated with developers to integrate AI capabilities for data analysis and visualization.
Ensured the AI can process uploaded data, analyze it, and generate relevant visual insights in real-time.
User Input and Data Upload:
Incorporated a simple and intuitive data upload feature, allowing users to drag and drop files or select them from their device.
Designed user input fields where users can specify parameters and preferences for the data analysis.
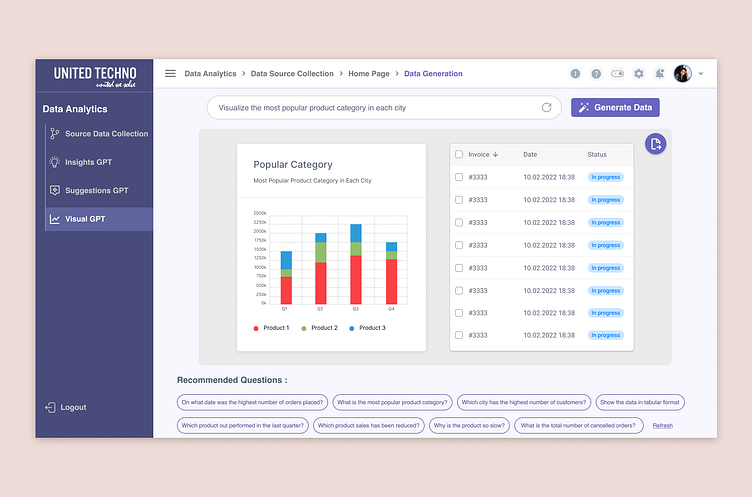
Dynamic Data Visualization:
Integrated a variety of data visualization widgets, including bar charts, line graphs, pie charts, and tables, to present insights effectively.
Ensured visualizations are dynamic and update automatically based on the uploaded data and user inputs.
The result is a powerful, user-friendly Visual GPT dashboard that transforms data into actionable insights through intuitive visualizations.
