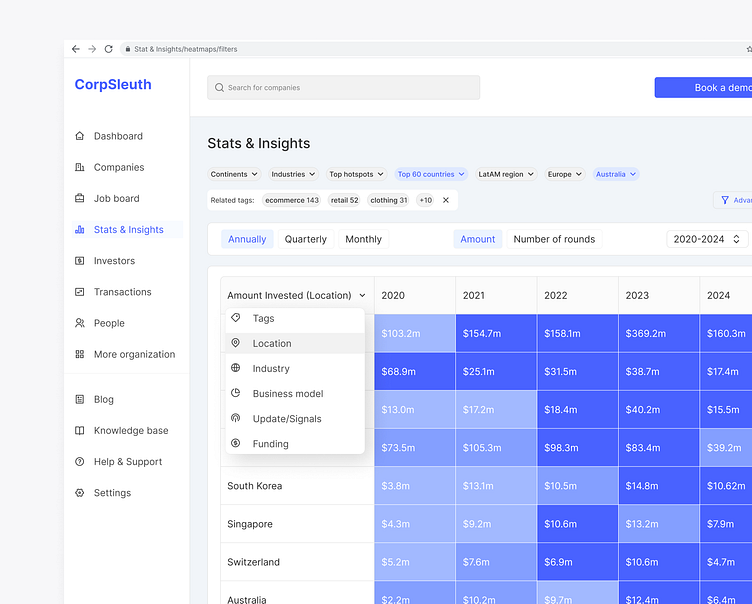
Stats & Insights - Research & Analysis App
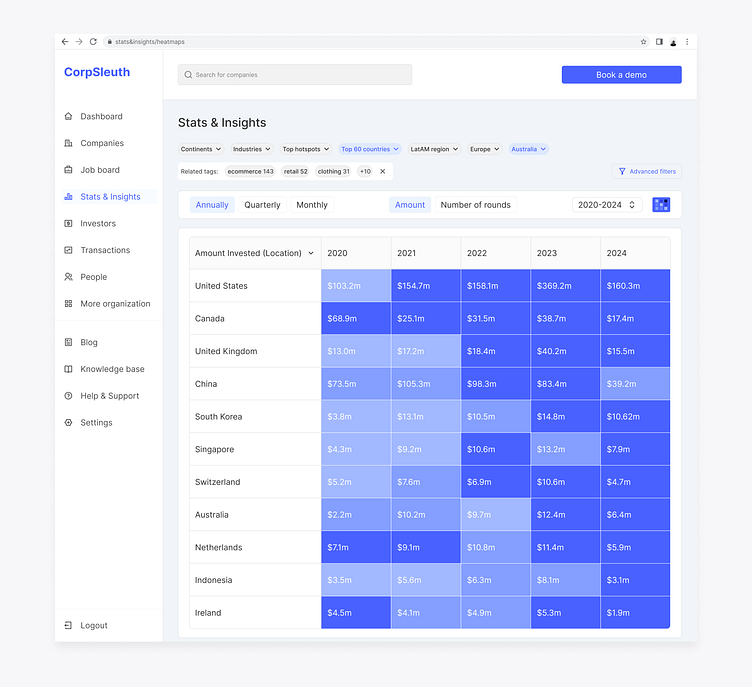
Using heat maps to explore key financial data metrics as opposed to conventional graphs. Speed and accuracy are priorities for users when running an analysis. I designed stats & insights to help them visualize, cluster data, and analyze metrics based on geography and other verticals.