Data Viz Chart Builder for FinTech Platform
The design:
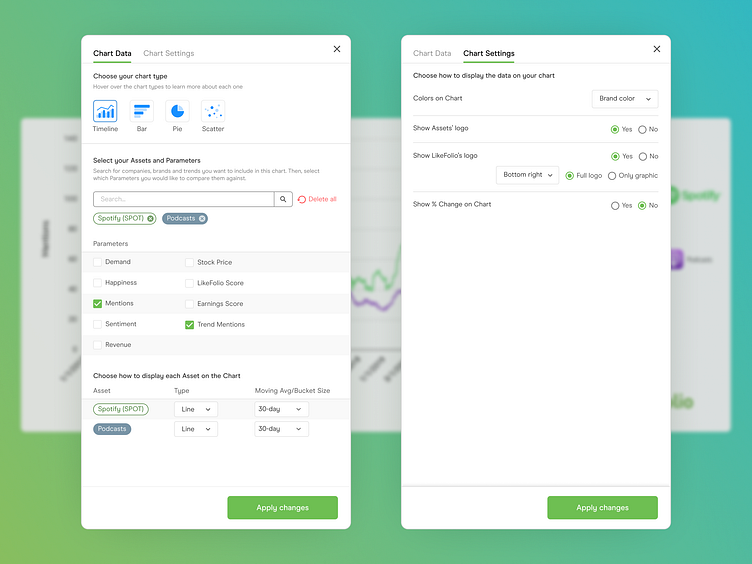
A view of the setup section for our client's proprietary Chart Builder feature, showing what steps, sections and Settings played a part in building a Spotify vs Apple Music Consumer Sentiment Line chart.
The goal:
To build a tool for our client's team to use their internal algorithms and data to build different types of Charts they could then export and share with their clients and social media, similar to Tableau.
The challenge:
There weren't many tools and features out there available we could reference, specially not using our client's internal and nuanced algorithms as data. It took many rounds of iterating between stakeholders, Design team and devs to bring their visions and needs to a working Design that then could be technically approved by the tech side.
The outcome:
We reverse built this tool by taking a bunch of different types of Charts our client was used to make in Tableau and saw what steps and Settings would be needed to make each one. In the end, we created a tool that did its job comprehensively, to be used internally but with plans to release as a paid feature to the public in the future.
What do you think? 👀
Work with us!
UserActive is a product design agency for B2B SaaS. We’re on a mission to help SaaS Founders create meaningful products users love.
Book a call 👉🏼 www.useractive.io