Data Analytics Chat with AI - Dashboard
As a UI/UX designer, I developed an innovative Data Chat with AI Dashboard, empowering users to upload their data, ask insightful questions, and receive dynamic visualizations directly from an AI-powered chatbot. Here’s a detailed look at the design process and key elements of this project.
Design Process
Persona Development:
Conducted surveys and interviews using Google Forms and Zoom to understand user needs and pain points.
Analyzed user behavior and preferences through tools like Hotjar and Google Analytics to inform design decisions.
Persona Development:
Created detailed user personas with Xtensio to represent different user types and guide the design process.
Documented personas and user journeys in Notion to ensure a user-centric approach.
Wireframing & Prototyping:
Developed wireframes to map out the structure and functionality of the dashboard using Figma.
Created interactive prototypes in Adobe XD to test user flows and gather feedback.
Visual Design:
Designed a clean, modern interface with a focus on readability and usability.
Selected a color palette and typography that enhance data visualization and ensure accessibility.
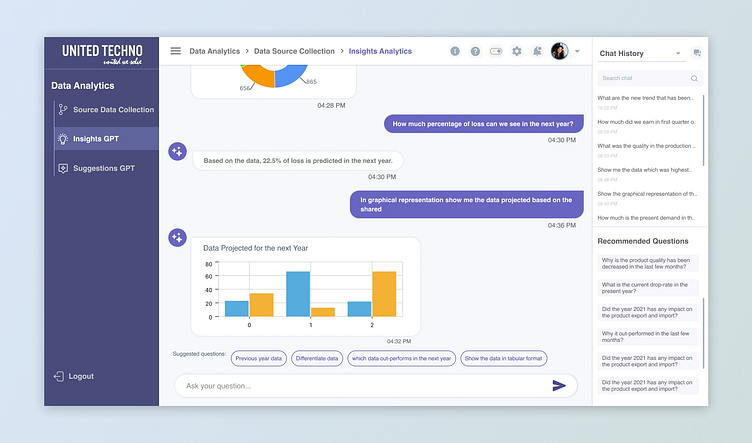
Dynamic Data Visualization:
Integrated various data visualization widgets, including charts, graphs, and tables, to present insights effectively.
Ensured visualizations are dynamic and update in real-time based on user queries and data changes.
The result is a powerful, user-friendly Data Chat with AI Dashboard that transforms how users interact with and analyze their data.
