Data Chat with AI Dashboard
As a UI/UX designer, I created an innovative Data Chat with AI Dashboard, combining intuitive design with powerful AI capabilities to enhance data analysis and visualization. Here's an overview of the design process and key features:
Design Process
User Research & Personas
Conducted user research to understand the needs of data analysts, business users, and decision-makers. Developed personas to guide the design process and ensure user-centric solutions.
Wire-framing & Prototyping
Created wire-frames to outline the structure and layout of the dashboard. Developed interactive prototypes to test user flows and gather feedback.
Visual Design
Designed a clean and modern interface with a focus on readability and ease of use. Selected a color palette that enhances data visualization while maintaining visual harmony.
Usability Testing
Conducted usability testing sessions to identify pain points and iterate on the design. Ensured that the dashboard is intuitive and meets user expectations.
Key Features
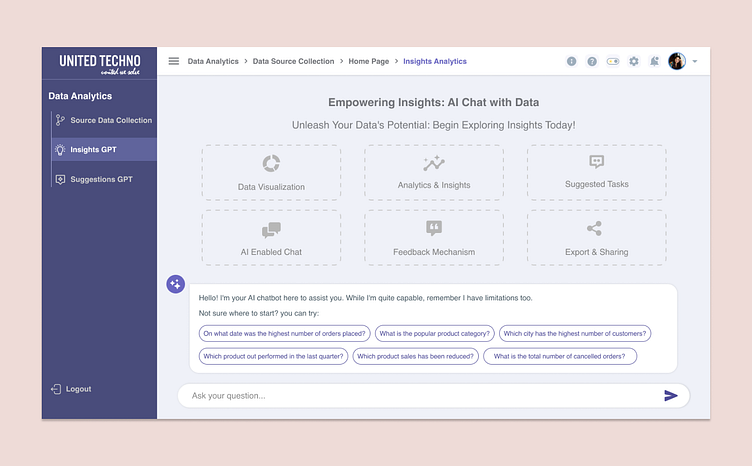
User Input Fields
Incorporated input fields for users to ask questions, enabling them to interact with the AI and generate tailored insights based on their data.
Dynamic Data Visualization
Integrated various data visualization widgets, including charts, graphs, and tables, to present insights in an engaging and easily interpretable format.
AI Integration
Leveraged AI capabilities to process queries, analyze data, and provide real-time insights. The AI responds to user input with relevant visualizations and recommendations.
Interactive Elements
Added interactive elements such as clickable buttons, dropdown menus, and draggable components to enhance user engagement and customization.
The result is a dynamic, user-friendly dashboard that empowers users to explore their data effortlessly and make informed decisions with the help of AI-driven insights.
Tools used
FIgma
