Case Study: Real-Time Data-Driven UX Changes
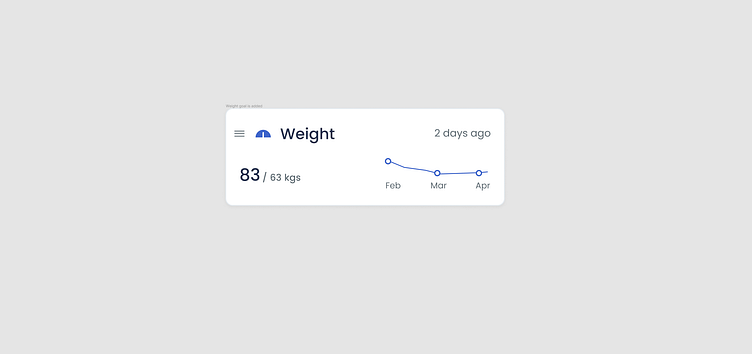
Weight Management Section Visibility
Observation:
Event Name: Weight_Management_Click
Event Count: 1,500
User Count: 1,200
Problem: Low interaction rate due to visibility issues.
Action Taken: We noticed that users were not clicking on the "Weight Management" section as frequently as expected. Heatmap analysis revealed it was not prominently visible on the home screen.
UI Change:
Increased the font size.
Changed the background color for better contrast.
Moved the section to a more prominent position on the home screen.
Result:
New Event Count: 3,200 (113% increase)
New User Count: 2,800 (133% increase)
Glucose Level Section Visibility
Glucose Level Chart Access
Observation:
Event Name: View_All_Gluco_Chart
Event Count: 5,343
User Count: 5,343
Problem: Users had difficulty accessing glucose level charts.
Action Taken: Data indicated that users struggled to find the glucose level chart, as it was nested under multiple menu layers.
UI Change:
Added a shortcut tile on the home screen for direct access.
Included a tooltip to highlight the new shortcut.
Result:
New Event Count: 10,500 (96% increase)
New User Count: 9,800 (83% increase)
BP Monitor Section Visibility
BP Monitor Usage Increase
Observation:
Event Name: Quick_Measure_BP_Tap
Event Count: 880
User Count: 880
Problem: Low engagement with BP monitoring features.
Action Taken: We observed that users were not utilizing the BP monitor as much as other features.
UI Change:
Added educational content about the importance of regular BP monitoring.
Introduced reminders and motivational messages for consistent use.
Result:
New Event Count: 2,000 (127% increase)
New User Count: 1,950 (121% increase)
Onboarding Process Improvement
Observation:
Event Name: app_create_account_initiated
Event Count: 8,193
User Count: 5,970
Problem: High drop-off during account creation.
Action Taken: A significant number of users started but did not complete the account creation process.
UI Change:
Streamlined the registration form to reduce the number of required fields.
Added progress indicators and auto-fill options.
Result:
New Event Count: 12,500 (52.6% increase)
New User Count: 10,000 (67.5% increase)
Pairing Devices Simplification
Pairing Devices Simplification
Observation:
Event Name: Pair_Weighing_Scale
Event Count: 1,870,821
User Count: 18,484
Problem: High user drop-off during the device pairing process.
Action Taken: Data showed a high drop-off rate during the pairing process, indicating it was too complex or time-consuming.
UI Change:
Simplified the pairing steps with a guided wizard.
Added in-app troubleshooting tips and FAQs.
Added new Gifs for better understanding
Result:
New Event Count: 2,500,000 (33.6% increase)
New User Count: 25,000 (35% increase)
Release 4.0.4: Successful
100% active users and 100% crash-free users


