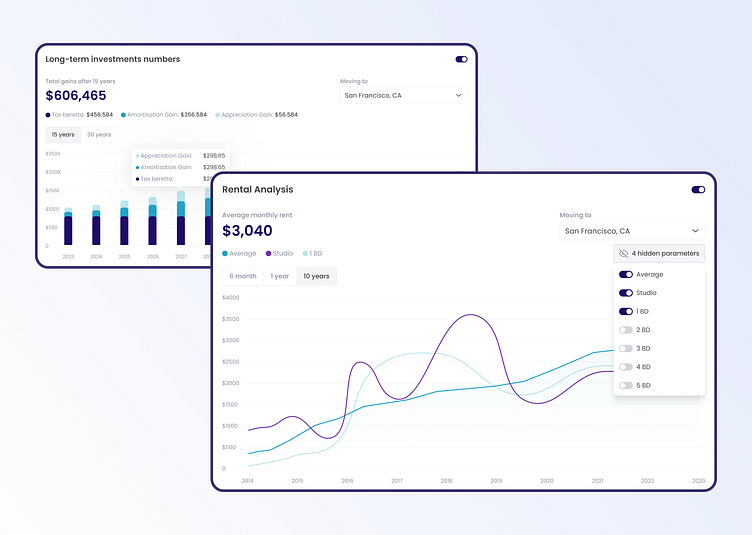
Mortgage platform charts | Dashboard design | Analytics
With a wide array of graph types and visualization tools, we have transformed complex mortgage data into clear, informative, and easily digestible graphics. These graphs are not just informative; they're interactive and user-friendly, making it simple to explore trends, compare options, and gain a deep understanding of the mortgage landscapeWhat do you think? Don’t hesitate to comment 😊
Let us know what you think. Thanks for watching and stay tuned for more 🚀
Have a project in mind? Contact us 📧
Follow us 📲
More by Quality Geek View profile
Like
