Banned Books, Data Visualization
Overview
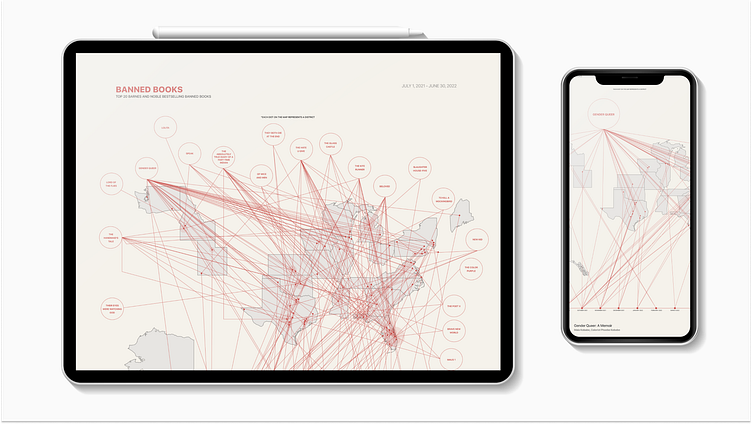
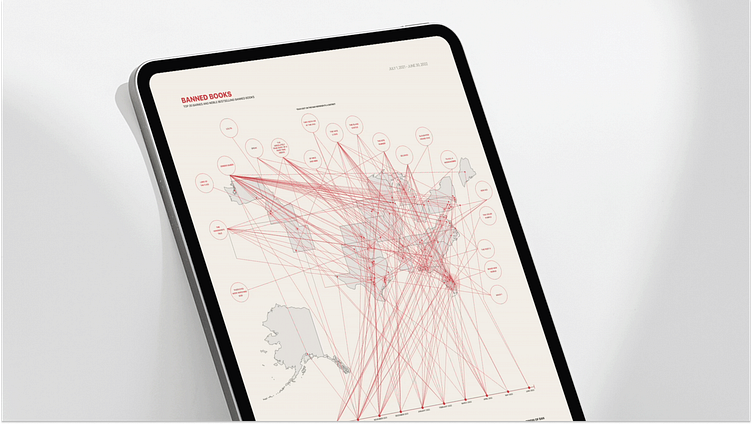
My project revolves around creating an interactive data visualization poster analyzing the top 20 banned books listed on Barnes and Noble's website from July 1, 2021, to June 30, 2022. Utilizing Figma, I transformed the extensive data provided by PEN America into an accessible and visually engaging format.
Challenges + Goals
For my data set, PEN America provided a comprehensive list of banned books which posed a challenge due to its size. To streamline the data, I focused on the top best-selling books on Barnes and Noble's website. Additionally, I meticulously verified the accuracy of district locations by cross-referencing and fact-checking each one. My aim was to render the extensive data from PEN America into a digestible and engaging format, shedding light on the prevalence of banned books. In choosing the color red, I aimed to underscore the potential harm these bans pose to diverse communities. While I initially considered using a broader color palette, I found it overwhelming and opted for a more minimalist approach to maintain clarity and intentionality in design.
Solution
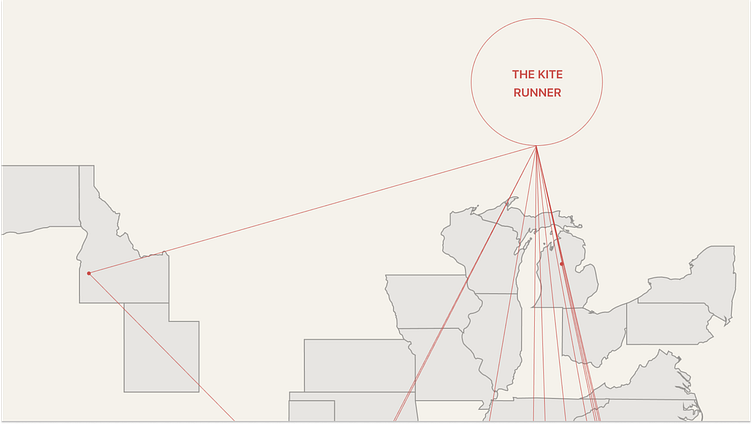
Placing the US map prominently at the top of the poster, I prioritized highlighting the books and their respective locations hierarchically. The use of concentric rings around certain districts provides additional visual cues, allowing readers to discern the concentration of banned books in specific areas. User interaction is facilitated through hover-over functionality, providing detailed insights into each district's bans. In crafting the timeline below the map, I aimed to introduce dynamic movement and aid in identifying trends in banning occurrences over time.
Result
The project successfully distilled a wealth of data into a visually compelling format, garnering significant interest from audiences. Through effective design choices and thoughtful organization, I was able to achieve my goal of creating a digestible representation of banned book trends. While alternative approaches involving coding were considered, this project underscored the importance of discipline and organization in managing complex datasets. Overall, I am proud of the project's outcome, which not only educated audiences but also reinforced the importance of meticulous organization in project execution.
