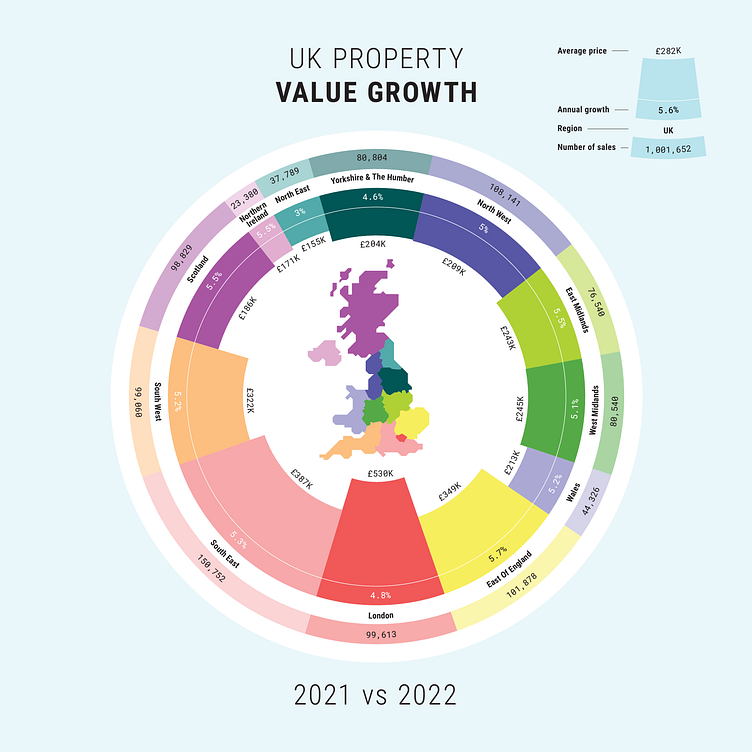
UK Property Value Growth infographic
This infographic demonstrates several dimensions of UK real estate data. Every geographic region is represented by a segment of the matching colour. The width of the outer circle segment corresponds to the number of properties sold, whereas the height of the inner arc represent average price of property in the region. Thus every regional market not only has a unique colour, but also a unique shape.
More by Daniil Alexandrov View profile
Like
