Data Dashboard - Insights & Sentiment Analysis Charts | B2B SAAS
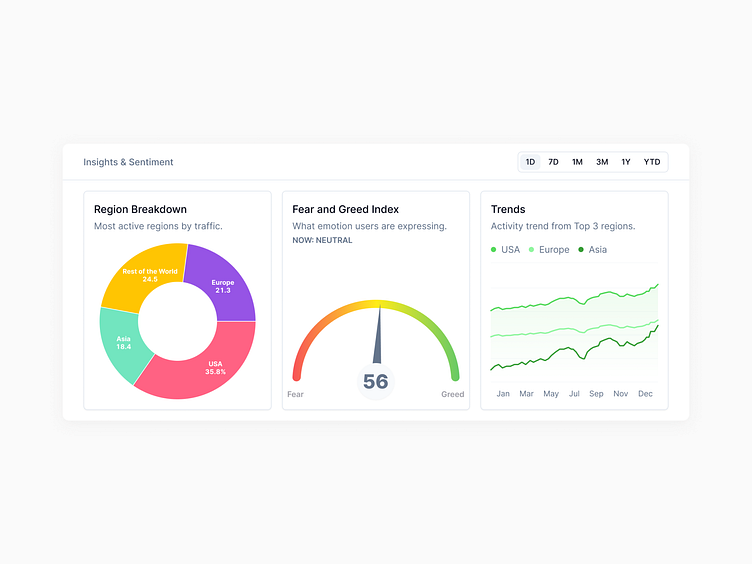
Data Visualization Dashboard with charts and graphs for B2B SaaS
Tools Used: Figma
Fonts: Inter Family
I help startups build clean, easy-to-use, and frictionless products leveraging good user experience.
End Goal: Your Product's UX is your competitive advantage.
💬 Get in touch to discuss your projects. 👇
