Data Visualisation: Levels of Detail
Why is important the different levels of detail in data visualisations?
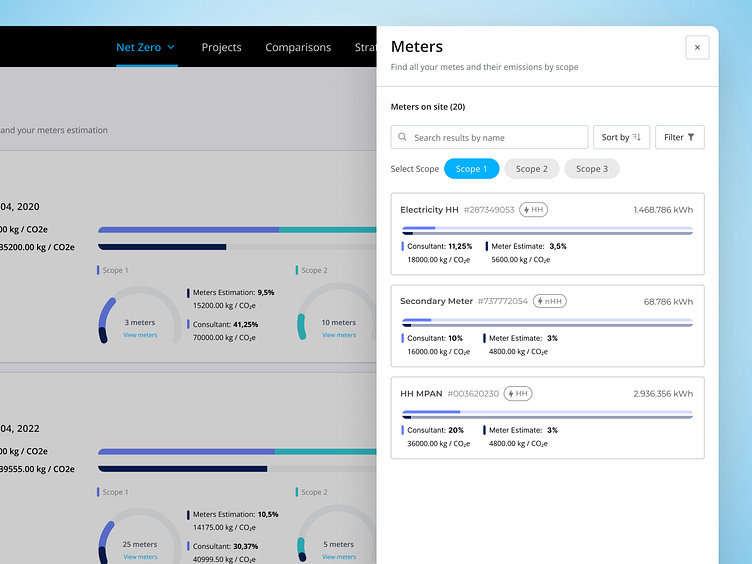
This design explores the importance of different levels of detail in data visualisations. Often, presenting all data at once can overwhelm users and hinder comprehension.
Using the emissions screen for Open Energy Market as an example, we've implemented various levels of detail, from an overview of annual emissions to a breakdown by individual meters and scopes, using a side drawer as a second level of detail.
This will help the user by:
✅ Reducing complexity and enhancing readability
✅ Creating patterns for showing different levels of detail in the future
✅ Promoting consistency across the platform as we are using the same type of data visualisation
Let me know your thoughts! 🚀
#DataVisualisation #UXDesign #UIDesign #OpenEnergyMarket
