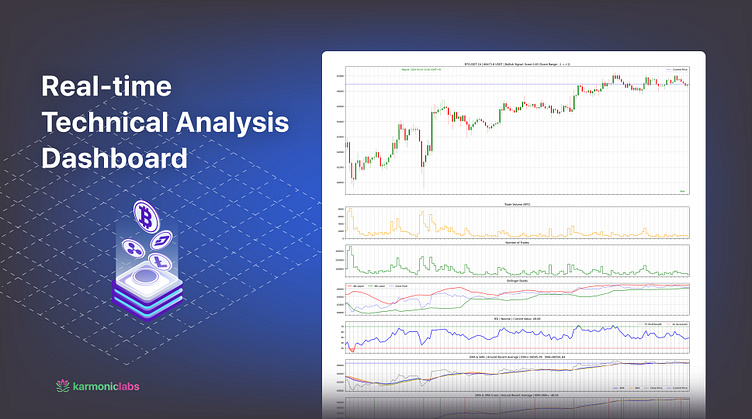
Real-time Technical Analysis Dashboard
Customizable Parameters, Multi-Indicator Tracking, Universal Cryptocurrency Support
A Python-based data visualization tool utilizing Matplotlib to provide comprehensive insights into financial asset price movements and key technical indicators such as RSI, SMA, EMA, Ichimoku Cloud, ADX, CCI, MACD, Stochastic Oscillator, ROC, ADI, CMF, OBV, and Bollinger Bands.
With a focus on color-coded charts and visually pleasing layouts, designed for traders and analysts, it offers customizable parameters for timeframe analysis, highlighting critical levels, divergences, and trend strengths.
More by Nima Mosayebi View profile
Like

