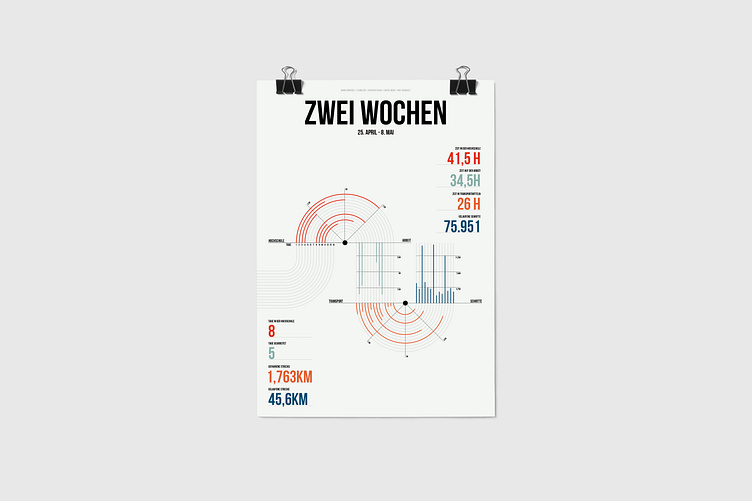
Infographic - Two Weeks
The infographic displays how I spend my time over the course of two weeks. Focussing especially on the most important aspects of my life: University, Work, Public Transportation and Walking. I decided to use a continuous bar graph with several starting points, therefore it is easy for everyone to understand, yet looks unique. The most important informations are displayed on the top right and the bottom left. The colours of the typography corresponding to the graphs of each aspect.
Dieses Projekt ist im Sommersemester 2022 im Studiengang Digital Media im Fach InterfaceDesign an der Technischen Hochschule Ulm entstanden.
Projektinitiator, Projektleiter und fachlicher Betreuer: Prof. Damian Gerbaulet.
Autor/-in und inhaltlich Verantwortliche/r: Hanna Förderer.
Das Projekt ist urheberrechtlich geschützt
