Designing Information and Data Graphics

Project Overview:
The project focuses on redesigning ornithological data and information from respected organizations such as BirdLife International and the IUCN Red List of Threatened Species. The primary aim was to transform complex and dense text-based content into a visually engaging narrative that resonates with a younger audience. By utilizing a blend of icons, illustrations, and other design elements, the project seeks to make the subject matter—specifically the alarming rate of bird species extinction—more accessible and compelling to a younger audience. This project integrates both analog and digital media to maximize outreach and engagement.
Project Objectives:
Simplification and Engagement:
The primary goal is to simplify complex ornithological data into visually appealing graphics that captivate and inform younger audiences. Context , frame of reference, cause and effect have to be visually clear.
Highlighting Urgency:
By focusing on the threats faced by specific bird species worldwide, the design will emphasize the critical situation of bird extinction.
Multi-Platform Integration:
The design seamlessly blends analog and digital touchpoints, ensuring a cohesive and engaging user experience across platforms.
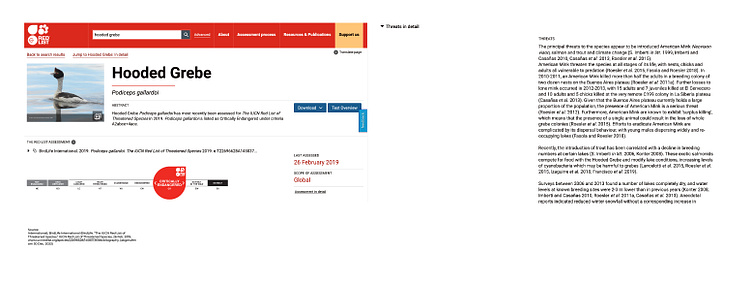
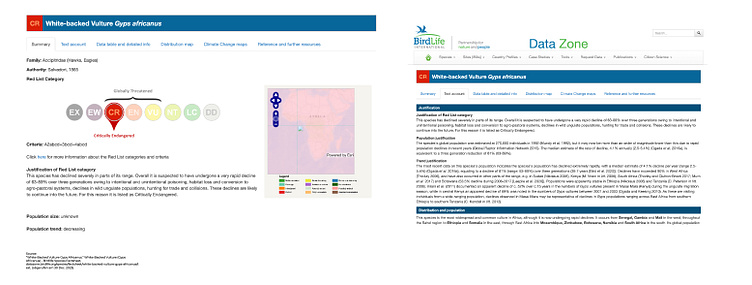
Examples of Current Ornithological Information and Data Visualization
Problem:
Current ornithological data visualizations are well-suited to scientific communities but fall short in engaging a broader, especially younger, audience. The existing visuals often fail to convey the urgency of bird extinction. They are too text heavy. Large abstract numbers are difficult to understand the significance of, and connections are not clear. Cause and effect is not clearly defined. The lack of visually engaging source material is a missed opportunity to raise awareness and drive action for bird conservation with a younger audience.


Solution:
To bridge the gap between scientific ornithological data and a younger audience, this project redesigns information from sources like BirdLife International and the IUCN Red List of Threatened Species into visually engaging and accessible formats. By transforming text-heavy, abstract data into compelling visuals, the project highlights the urgency of bird extinction and makes cause-and-effect relationships clear. The goal was to create an impactful and educational experience that drives awareness and action for bird conservation among younger audiences. This was achieved through the following aspects:
Analog Touchpoints:
Banners and postcards serve as analog mediums, providing brief yet impactful introductions to each featured bird species. These act as teasers, encouraging further exploration through digital channels.
Digital Touchpoints:
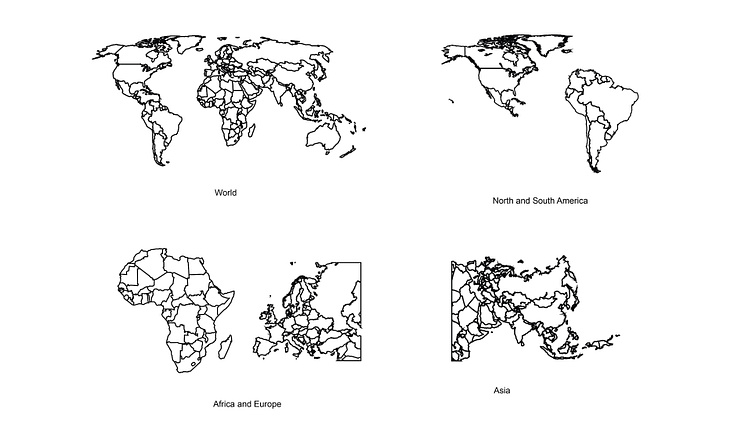
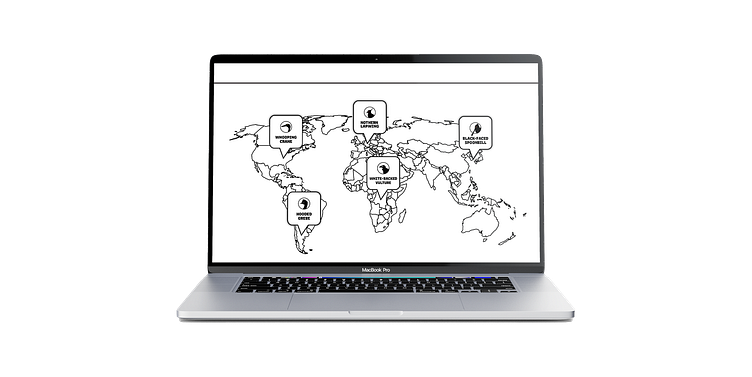
A website serves as the central digital platform, featuring an interactive world map. Users can explore this map to discover various bird species by region. Upon selecting a bird, users will be presented with detailed information about the species, including the specific threats it faces or conservation efforts.
Seamless Integration:
QR codes are integrated into analog materials connecting with digital mediums. This ensures that the audience can access more information, more than on the analog roll-up banner.
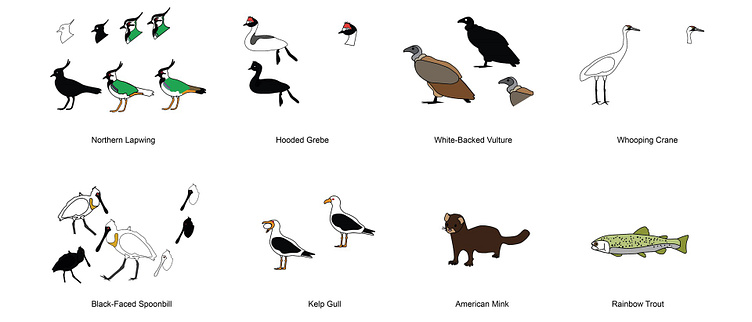
Solution Implementation based on the Northern Lapwing:
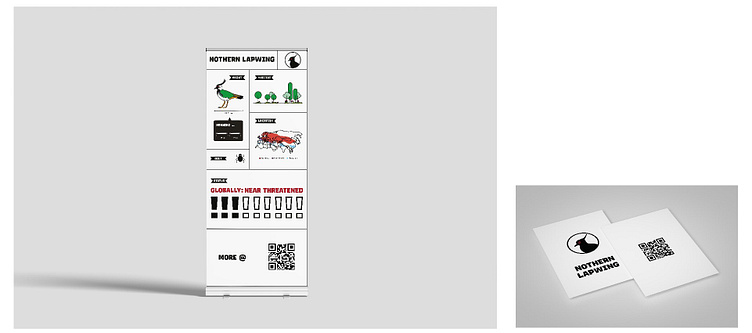
Analog Touchpoints:
Posters and postcards offer brief, visually striking introductions to the Northern Lapwing. These analog materials act as teasers, capturing the audience’s attention and piquing their interest. Each piece includes a QR code that directs users to the digital platform for more comprehensive information.
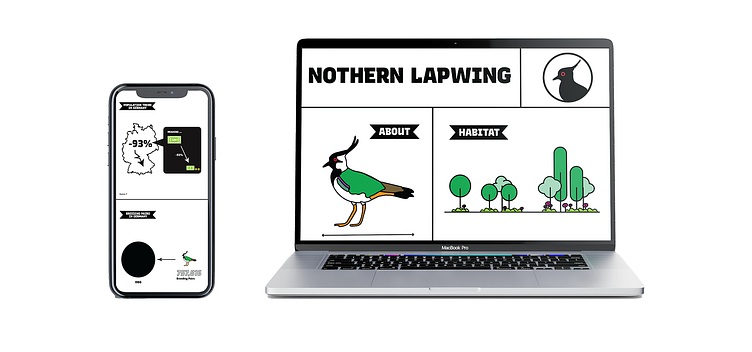
Digital Touchpoints:
The project’s website serves as the central hub for further content. Users can learn more about the Northern Lapwing’s habitat, understand the specific threats it faces, and learn about ongoing conservation efforts. This digital space provides a more immersive and detailed educational experience that complements the analog materials.
Further Implementation for Other Birds:
The same principles and mediums are applied for other birds. A world map showcases a multitude of bird species. Users can select their preferred regions, prompting recommendations of specific birds indigenous to those areas. Upon selecting a bird of interest, users can gain more detailed information about the chosen species. This experience allows for navigation, enabling users to freely explore the map and discover a diverse array of bird species.
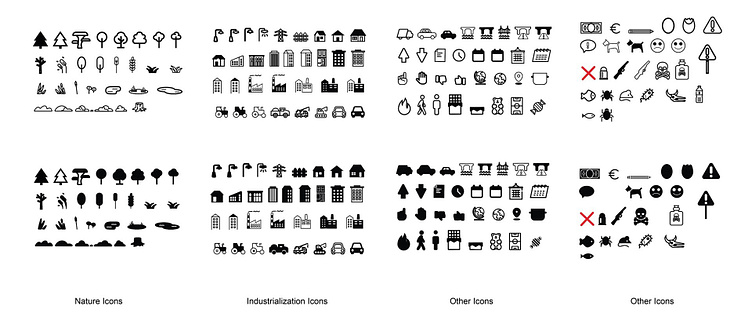
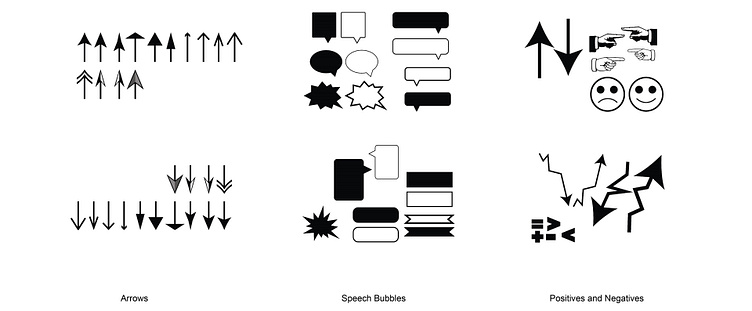
Design Elements:
A diverse array of visual elements were employed, including icons, illustrations, typography, and maps. These were combined to create new visuals that make the data both informative and visually compelling. The icons were the main building block of the project. These could be combined to create new representations. For instance various trees could be combined to represent a bird’s habitat, or a tractor and wheat could be combined to represent the threat of industrial farming, or buildings and trees could be combined to represent the threat of habitat loss.