Day 18: Bar Graph
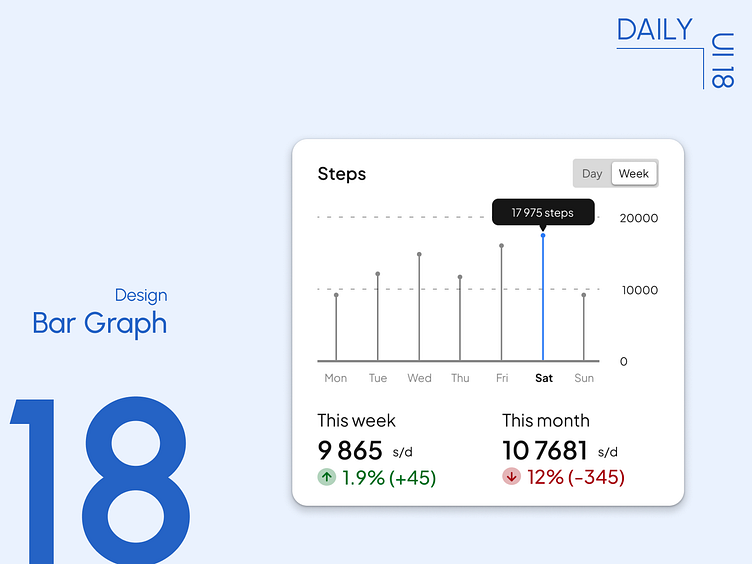
This is day 18 of my 90-day Daily UI Challenge!
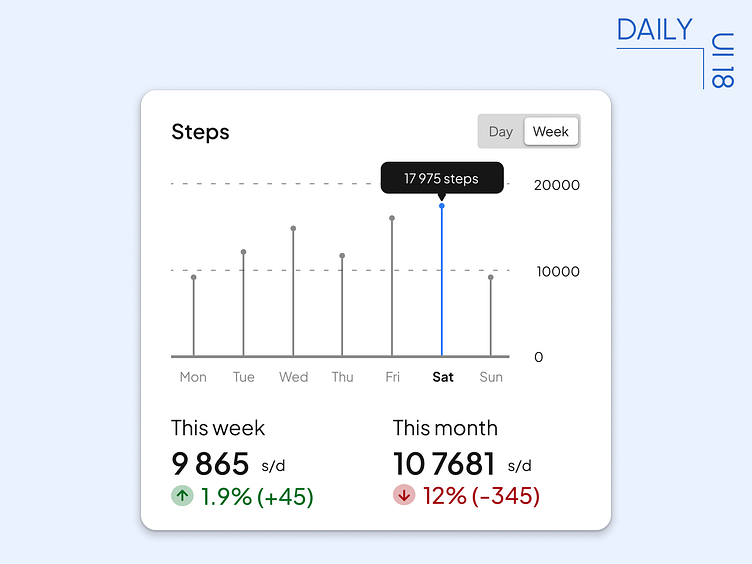
Today's goal was to design a bar graph chart with sample data. This design prioritizes clear communication and easy data comparison, featuring well-labeled bars and a clear value axis. I used contrasting colors for the bars to enhance readability and kept the x-axis labels concise for optimal clarity.