Day 17: Line Graph
This is day 17 of my 90-day Daily UI Challenge!
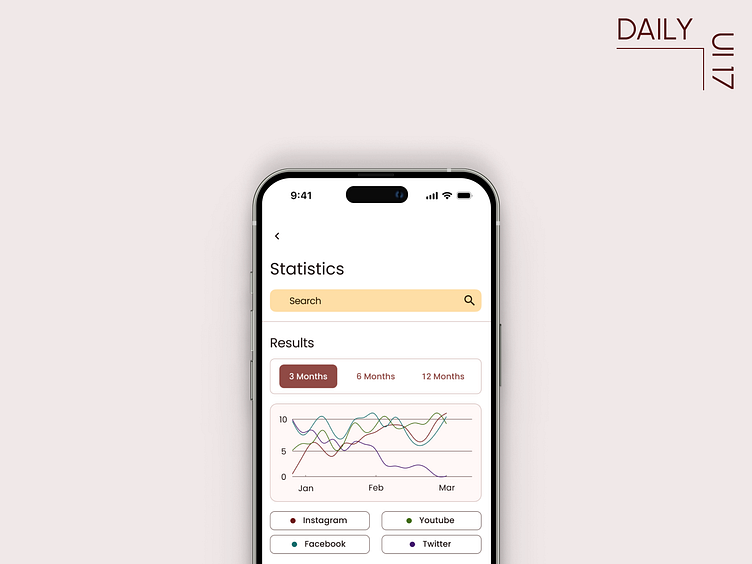
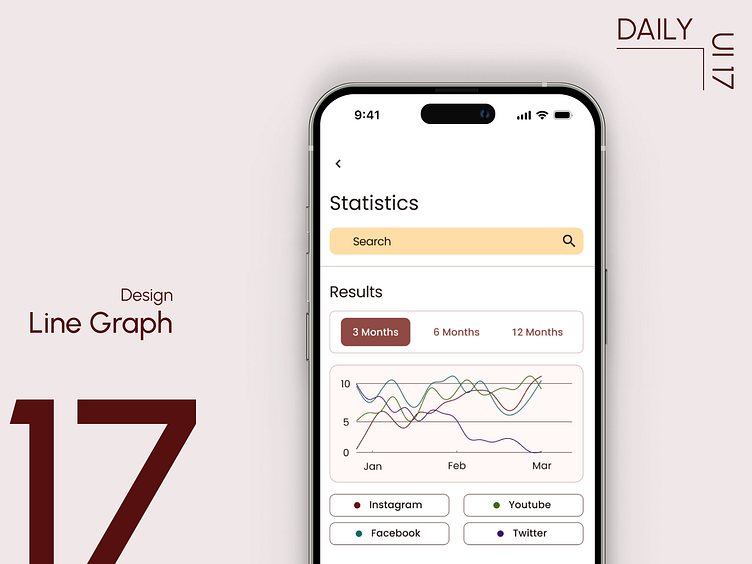
Today's goal was to design a simple line graph chart with a legend. This design prioritizes clarity and effective data visualization, allowing users to easily understand trends over time. I used clear labels and a distinct line to represent the data, and incorporated a legend for easy reference.