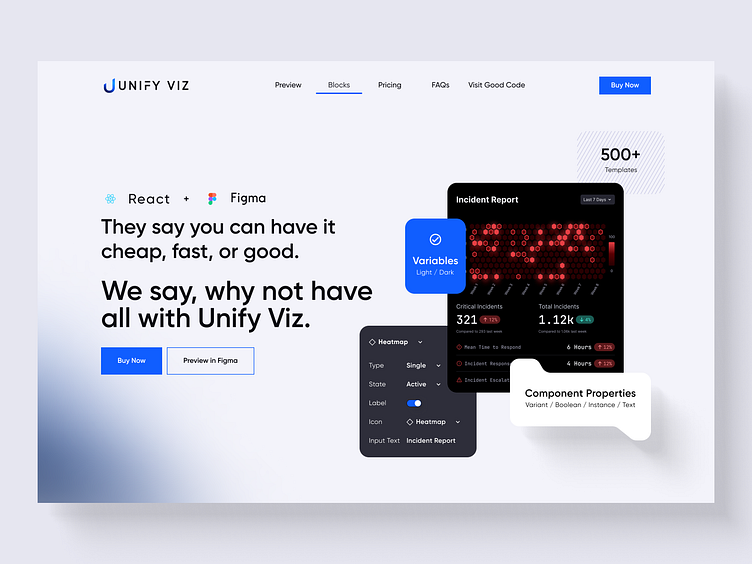
Unify Viz Blocks - 500+ Chart Blocks
Welcome to Unify Viz Blocks 2.0!
We're excited to share some big news with you. Our team has been working hard, and it’s finally here: Unify Viz Blocks 2.0! With this update, we're adding more than 500 new blocks to our already robust library, empowering you to create even more stunning charts, graphs, and dashboards directly within Unify.
Each block has been meticulously crafted to not only enhance the visual appeal of your data presentations but also to make data analysis more intuitive and insightful. From dynamic area charts and detailed bar graphs to insightful funnel charts, comprehensive heatmap blocks, and revealing scatter plots, Unify Viz Blocks 2.0 offers a diverse range of options to suit your every need.
84 Area Chart Blocks: Visualize data trends over time with new levels of depth and clarity.
196 Bar Chart Blocks: Compare different data sets with ease, thanks to enhanced detail and customization options.
32 Funnel Chart Blocks: Track conversion rates and process efficiency with precision, identifying opportunities for improvement.
170 Heatmap Blocks: Discover patterns and correlations within your data, making complex data sets understandable at a glance.
40 Scatter Plot Blocks: Explore the relationships between variables, unlocking new insights with sophisticated analytical capabilities.


