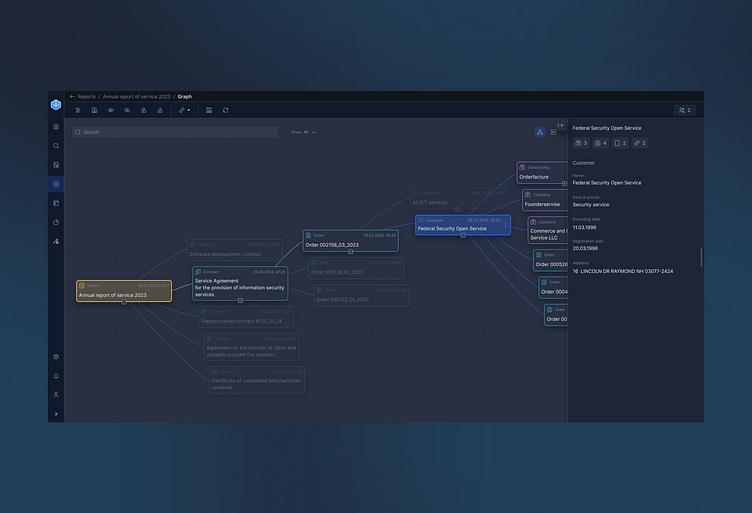
Node graph full version
Hi all!
This screen displays the connections between contracts and customers in the form of a graph (all data is provided as an example; in a real project, a graph of connections between documents, objects and tasks is built).
Each element type has its own stroke color and icon. The source element for which the graph is built also has a fill so that the user can always quickly find it if the graph displays a large number of elements.
If an element has child links, the user can control their display using the plus button.
When one of the child elements is selected, all others automatically become translucent so as not to distract the user from the selected element and its relationships.
When you double click on an element, a side card with information about it opens. At the top of the card there is a panel with buttons that, when clicked, reveal additional information on the card. Depending on the type of item, the card will contain different information.
