3D infographic, Creative infographic
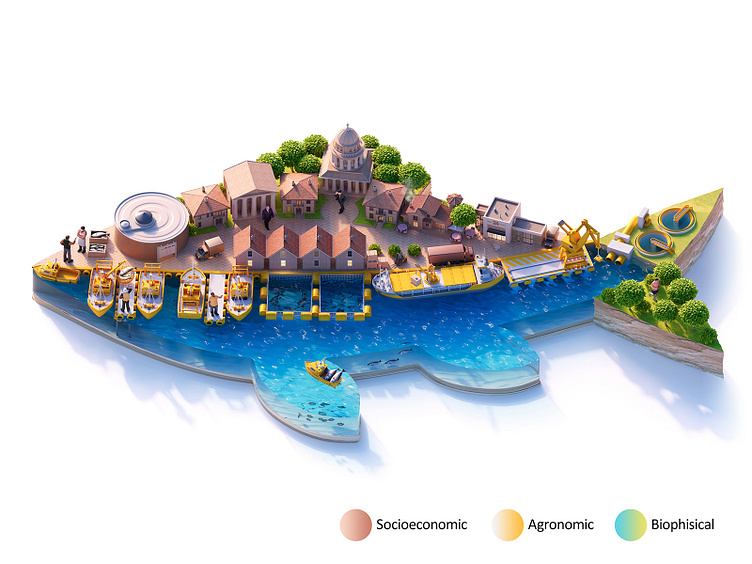
In this project, I needed to visually explain the term — Foodscape.
Foodscape is a whole complex of systems and elements involved in the food production. Roughly speaking, this is all that is behind the product on your table.
After reading some articles on the topic, I began to draw rough sketches of what it might look like. One of them seemed to me quite interesting — a pineapple consisting of a mosaic of elements involved in its production.
And it's literally a Foodscape!
But when I finished the rough sketch, I realized that the image wasn't universal enough and was quite dull in the shape of the pieces. I wanted to find a product that would be produced all over the world and at the same time whose shape would be instantly recognizable. Fish fits perfectly!
After approval of the idea, I created a detailed sketch.
The factors included in the term Foodscape are divided into three large groups — Biophysical, Agronomic and Socioeconomic. I planned to use colors to highlight them, so the rough black-and-white sketch wasn't enough and I made a color one.
But such a fish seemed to me too geometric and not so recognizable, in addition, factors from these three groups were scattered in different parts of the image. So I decided to combine the groups into united shapes, and make the main shape more elegant.
Fortunately, the client supported these changes and I began thoroughly improving the models step by step. In the process, I also added people to the scene as an integral part of the Foodscape and changed the color of the Agronomic Group.
My favorite detail about this infographic is that the canning factory also is the eye of the fish!
Thanks!


