[FREEBIE] Xiketic Charts Library v2
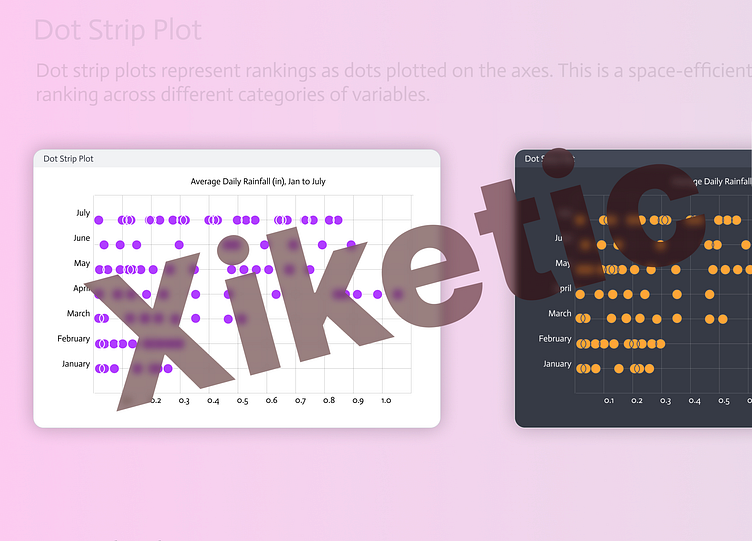
Tried to go with different types of charts based on usage.
The text and consideration for this was taken from
https://blog.gramener.com/types-of-data-visualization-for-data-stories/
Different types of use cases are as mentioned below
Bar and Column Charts
to show deviation
to show ranking
to show distribution
These can be useful for anyone starting with data visualizations.
Some examples are shared below
More by Tara Arya View profile
Like


