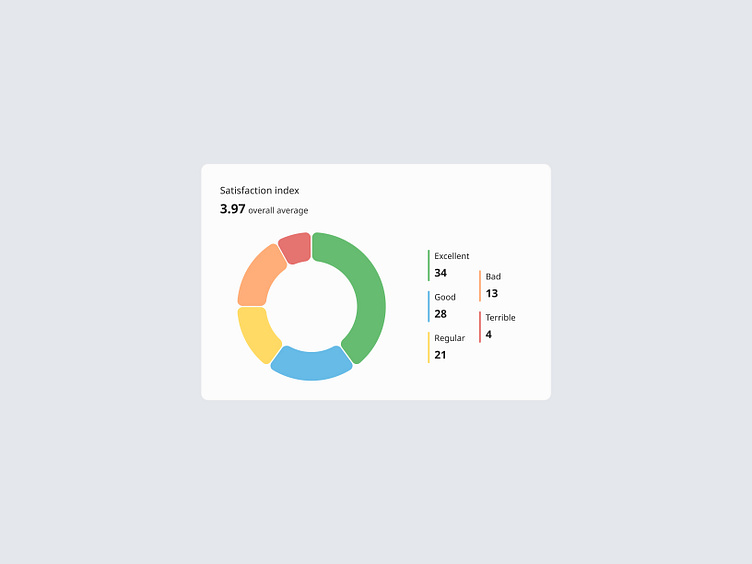
Donut Chart

Donut chart made in Figma with autolayout to display the customer satisfaction index on a service system monitoring dashboard.
Allows the user to click to access a more in-depth analysis of the item.
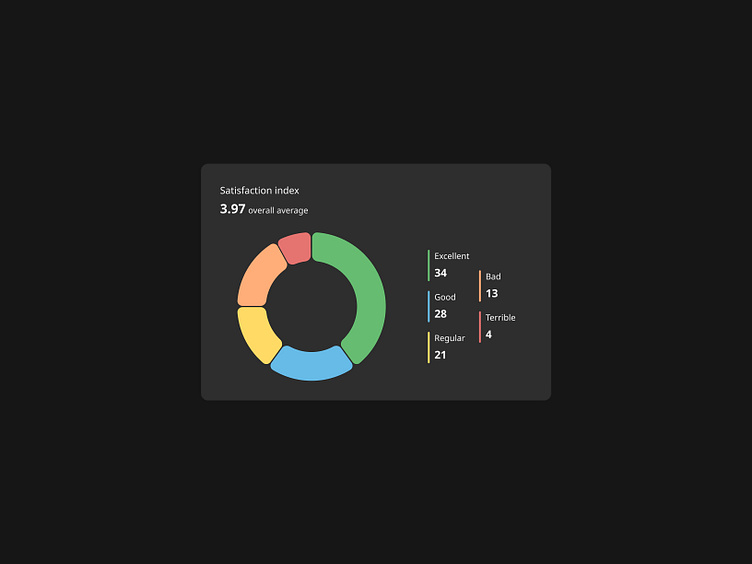
Donut chart made in Figma with autolayout to display the customer satisfaction index on a service system monitoring dashboard.
Allows the user to click to access a more in-depth analysis of the item.