Daily Ui 66 - Statistics
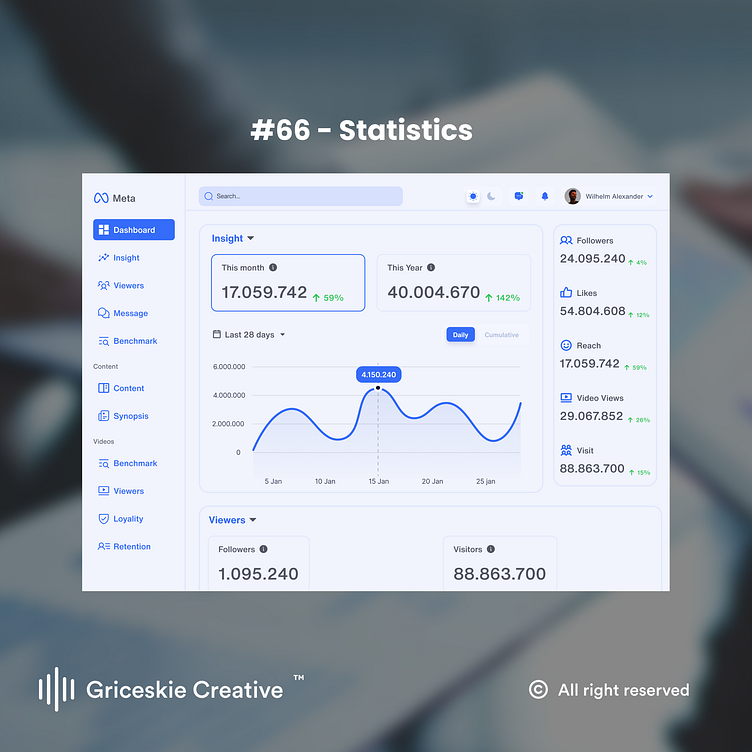
Gain valuable insights into your online growth with this reimagined Meta dashboard! 📈
Clean visuals and clear data displays track key metrics like monthly/yearly increases of Followers, Likes, Reach, Video Views and Website Visits.
Switchable graph modes allow you to visualize different stats over time with just a tap. Bold colors and negative space create a focused, high-level overview.
I aimed for an intuitive UI that surfaces actionable intel while keeping the interface uncluttered. Let me know your thoughts!
What other engagement metrics would be useful to monitor on this dashboard? Looking forward to your feedback on enhancing social media insights!
More by Rener Aljustyo View profile
Like
