Daily UI Challenge #18 - Bar Graph chart
Daily UI Challenge #18 - Bar Graph chart
Hey all👋🏻,
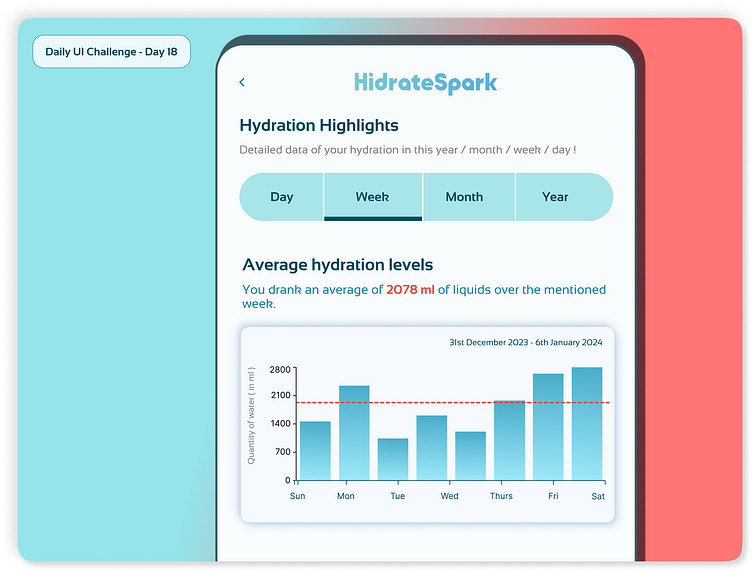
My 18th daily UI challenge in the Hype 4 Academy (72 more to go !) - Bar Graph chart.
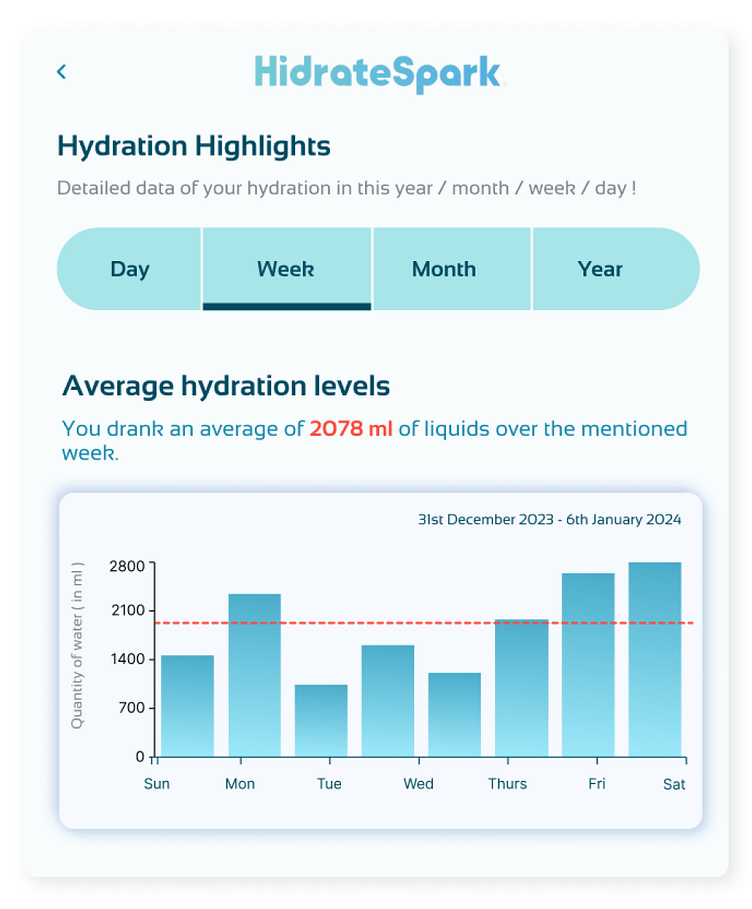
A Bar graph chart is designed here as the data visualisation of Average Hydration Levels of the HidrateSpark app ( redesign ).
Relating the challenge to my redesign project of HidrateSpark - a smart water bottle sold at AppStore, recreated this Social challenges screen design showing the Line graph chart with legend. Hope you like it !
Feel free to give your suggestions for improvement.
And press [ L ] if you ❤️ it! :-)
I am available for new UI design projects!
Drop a mail at Bhawana.CreativeStudio@gmail.com
