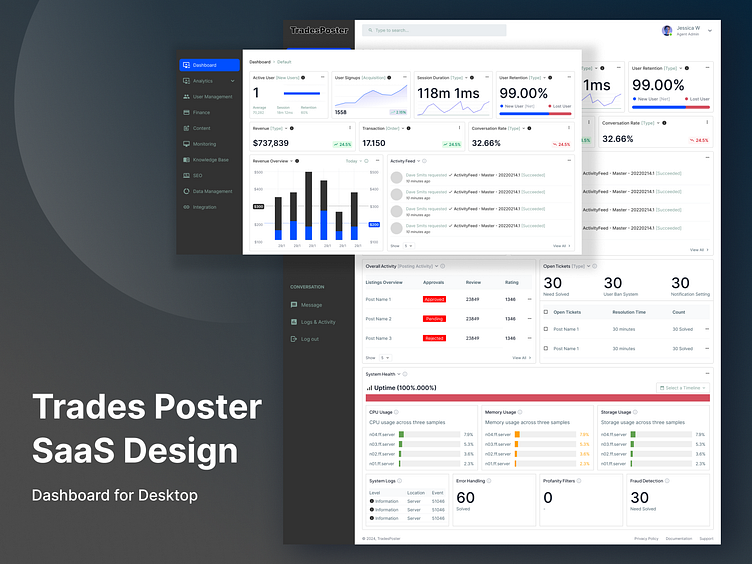
Trades Poster Dashboard
Recently I Designing on this Dashboard, tools are provided for organizations to measure, monitor, and manage business performance, both from financial and non-financial aspects. Designing this Dashboard aids in monitoring the achievement of company performance by displaying key metrics such as user activity, financial analysis, support tickets, and system health. Key metrics include the number of active users, the rate of new sign-ups, session duration, user retention, revenue, transaction volume, conversion rate, open support tickets, resolution time, system uptime, and resource utilization like CPU, memory, and storage. With this information, organizations can quickly assess and enhance their performance.
More by faiz zakharia View profile
Like
