Pie Chart | Data Visualisation
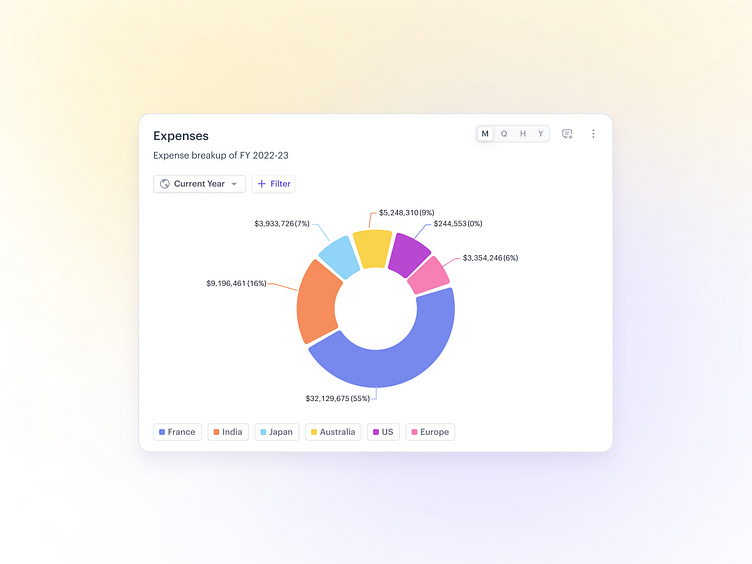
Showcase of an exploration for Pie Chart, also referred as Donut chart. The design features a clean and modern look with a focus on simplicity and usability.
Each chart comes with a filter, legend, roll-up and comments.
More exciting stuff sharing soon 🥳
If you find this design appealing, don't hesitate to leave a like 👍
----------------------------------------------------------------
We are ready for new projects 🤠
Send inquiry to: 📨 42@turinglabs.in
or visit our website: 🌐 turinglabs.in