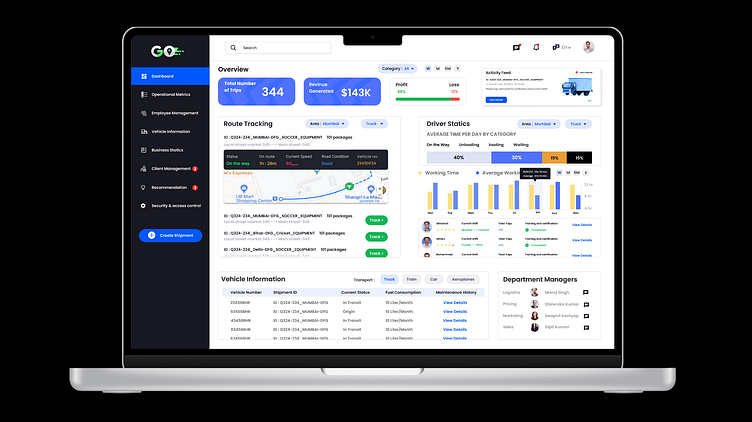
Transport Company Dashboard

Here's a user persona for a Transport Company Owner/Manager:
1. Name: Alex Thompson
2. Role: Owner/Manager of Thompson Transport Solutions
3. Background: - Over 15 years of experience in the transportation industry. - Started Thompson Transport Solutions to provide efficient and reliable transportation services.
4. Responsibilities:
- Strategic decision-making for the entire company
- Overseeing financial performance and profitability.
- Ensuring operational efficiency and timely deliveries.
- Managing relationships with key clients and stakeholders.
- Setting long-term goals and growth strategies.
5. Goals and Objectives:
- Maximize overall business profitability.
- Enhance operational efficiency and resource utilization.
- Foster positive client relationships and secure long-term contracts.
- Stay informed about the performance of the fleet and employee operations.
- Identify areas for improvement and implement strategic enhancements.
6. Needs and Pain Points:
- Comprehensive Overview: A dashboard that provides a complete snapshot of the business operations and performance.
- Financial Insights: Access to detailed financial statistics, profit and loss statements, and client-specific revenue breakdowns.
- Operational Visibility: Real-time tracking of the fleet, operational metrics, and alerts for immediate issues.
- Strategic Recommendations: Automated suggestions for route optimizations, maintenance alerts, and potential areas for cost reduction.
- User-Friendly Interface: An intuitive and easy-to-navigate dashboard that allows quick access to critical information.
- Data Analysis: Tools for in-depth data analysis and decision-making support.
7. Usage Patterns: - Regularly reviews the dashboard to make informed decisions. - Focuses on financial reports, client-specific metrics, and operational efficiency.
- Prioritizes strategic enhancements based on the insights provided by the dashboard.
- Engages with different sections of the dashboard to address specific business needs.
8. Preferred Communication Style:
- Prefers clear and concise data representation.
- Values actionable insights and recommendations.
- Appreciates visual elements for quick interpretation of key metrics.
9. Potential Feedback:
- Expects the dashboard to evolve with the changing needs of the company.
- Values customization options to tailor the dashboard to specific business requirements.
- Desires regular updates on new features and improvements.
Reasoning for my Design Choices:
- Logical Flow: Arranged sections in a logical flow, starting with immediate operational metrics and gradually moving to broader business statistics and external factors.
- User Priorities: Prioritized sections based on user priorities, placing critical information towards the top for quick visibility.
- Related Information: Grouped related information together to provide a cohesive understanding of different aspects of the business.
- Efficiency: Considered the frequency of access to each section and place the most frequently accessed ones in prominent positions for efficient use.
- Visual Hierarchy: Created a visual hierarchy with larger or more prominent elements for critical information and smaller elements for supplementary or less critical details.